Auto logout in seconds.
Continue Logout
Risk-based contracts can yield significant benefits when they are intentionally and rigorously structured. Organizations often struggle with risk contracting due to limited access to timely cost and quality data, a lack of long-term investment, and misaligned expectations with payers, which can lead to financial underperformance in contracted areas. This structured four-step risk contracting strategy can help provider organizations enhance their contract negotiations with strong data analysis and competitive evaluations.
Why strong risk contracting is essential
Risk contracting is a core component of organization’s financial and clinical strategy. It can help providers ensure a continuous stream of revenue and margin support even if utilization dips.1 Risk contracting can also help organizations increase their market share through greater attribution and reductions in avoidable, low-margin utilization.
However, misaligned expectations, limited data sharing, and underinvestment in analytics often undermine risk contracting.1 Providers also may not have adequate infrastructure for population health and data analytics, which can limit their capabilities and make progress harder to track.
If organizations are not prepared, they may enter risk contracts that are weighed against them or provide limited benefits. For example:
- Contracts may include inflexible performance measures that an organization can't meet, which leads to the organization missing out on some financial rewards.1
- The contract may involve retrospective instead of prospective payments, which can make it harder for small, rural, or safety net providers to invest in necessary infrastructure or sustain changes to care delivery.2
- The contract may not include any safeguards to help limit how much a provider can lose in a contract. Without safeguards, providers face increased uncertainty and could face excessive financial losses.2
Organizations must invest time and effort to ensure they are able to negotiate terms that are best for their needs. Compared to health plans, providers often have less resources and experience when it comes to actuarial analysis and risk contracting, which puts them at a disadvantage.
A holistic risk contracting strategy, which includes market and payer analyses, can help organizations enhance their contract negotiations with concrete data and numbers, realize savings, and develop a strong value proposition that helps set them up for future success.
Publicly available hospital pricing data can inform contract negotiations by grounding discussions in market insights. However, the amount of data available is substantial and often difficult to parse through.
A price transparency data lake enables more efficient analysis of large, complex datasets. The lake helps store and manage large volumes of data in a centralized repository. It also uses big data technologies and techniques, including data scraping, cleansing, and analytics, to create usable dashboards and reports.
With the help of an actuarial team, organizations can use hospital price transparency data to perform comparative analyses of their market reimbursement rates across payers and against peer hospitals.
A typical competitive analysis includes:
- Extracting commercial rates from published machine-readable files for a select group of payers and providers and normalizing this data to account for different reimbursement mechanisms.
- Analyzing extracted rates to identify payer networks and organizing provider rates into a rate template.
- Repricing a sample set of claims data to rates across providers to account for different rate structures, market position, and plan type. Rates are often shown as a percentage of Medicare reimbursement to standardize comparisons.
The chart below illustrates relative reimbursement performance across different organizations. It compares an organization’s reimbursement for inpatient, outpatient, and both types of claims to others in the same market as a ratio of Medicare reimbursement.
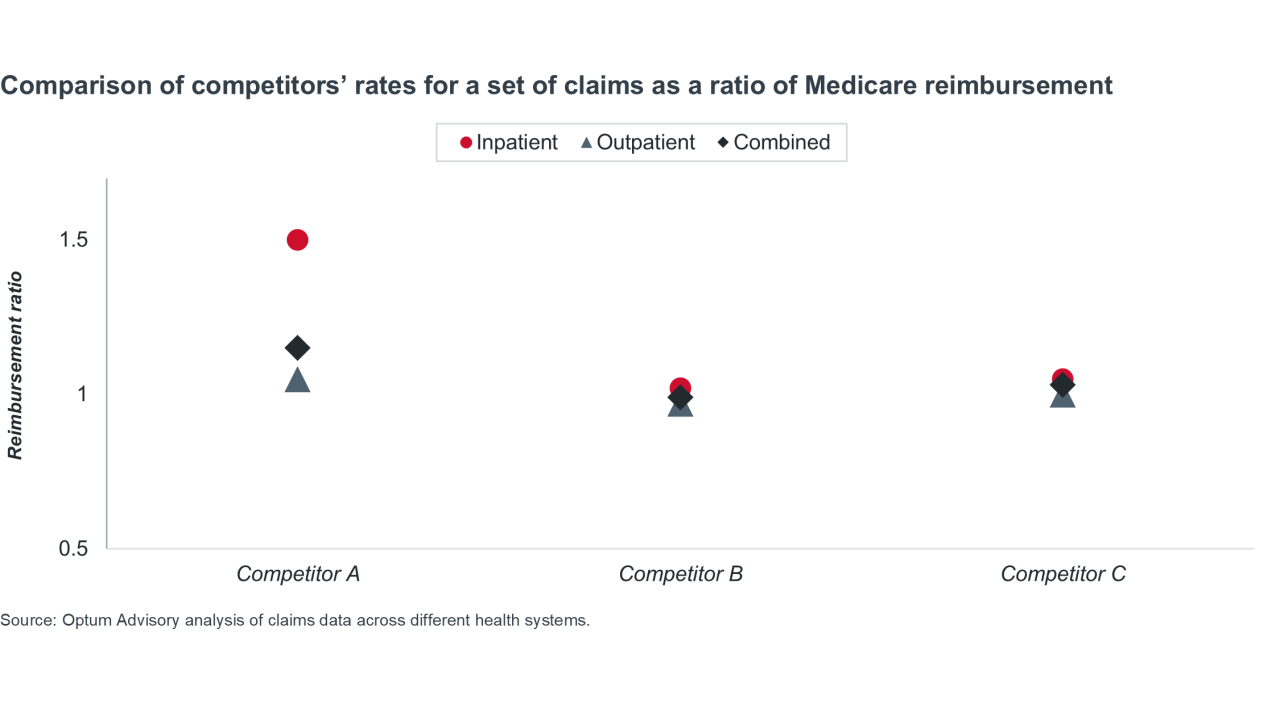
In the previous chart, Competitor A has higher reimbursement for inpatient claims while its reimbursement for outpatient claims is roughly the same as the original organization. In comparison, the difference in reimbursement for Competitors B and C is much smaller.
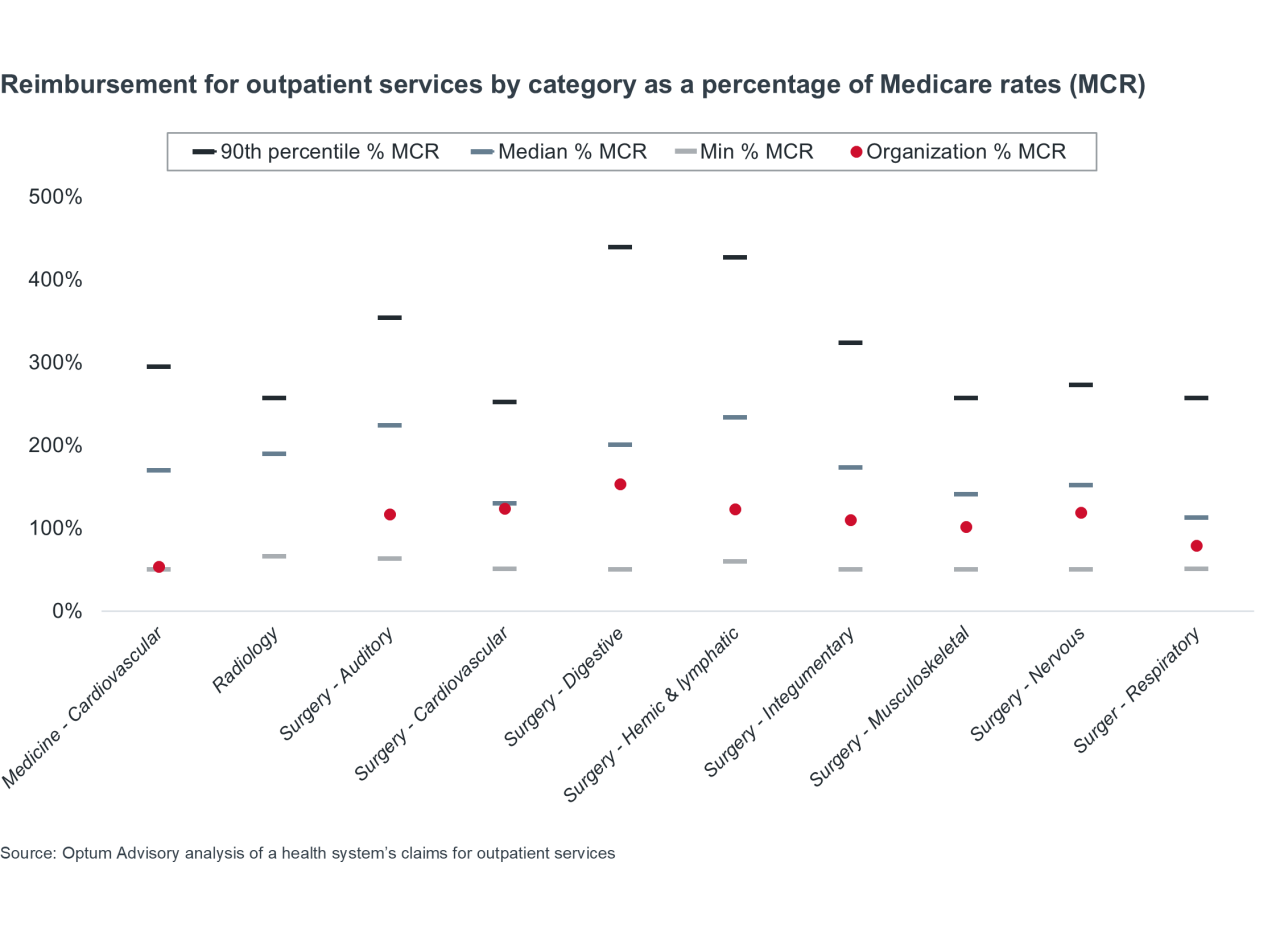
The chart below compares the reimbursement rates for different outpatient services. All rates are shown as a percentage of Medicare rates. The example organization’s reimbursement rate is shown in red and compared to the minimum, median, and 90th percentile reimbursement rates.
Based on the chart, the example organization’s reimbursement for different outpatient services often falls below the median reimbursement rate.
Before organizations can add risk components to their payer contracts, leaders should first understand their fee-for-service (FFS) reimbursement. Organizations' FFS reimbursement can affect total shared savings and budgets, as well as contract negotiations. Having lower FFS reimbursement while providing high-quality care could also better demonstrate value to payers. In general, FFS reimbursement and risk components are intertwined, and organizations should consider them in conjunction with each other rather than separately.
These analyses will help organizations understand trends in their volumes and how their rates perform against their competitors. These analyses can help organizations determine their position in the market while also providing valuable insights and data to help guide their contract negotiations with payers. For example, organizations can discrepancies with competitors to support the need for rate improvements from payers.
Once provider organizations understand their competitive positioning, they should compare their contracts across different payers, including by line of business (commercial, Medicare Advantage, Medicaid managed care).
Effective payer scorecards should incorporate:
- Actual reimbursement vs. expected reimbursement
- Maximum amount of potential earnings vs. what an organization is contracted to earn
- How reimbursement compares to Medicare reimbursement
- Denial percentages
To ensure comparability across payers, organizations should perform Medicare relativity calculations to evaluate all contracts as a percentage of Medicare.
Competitive analyses and payer scorecards offer leaders a more comprehensive view of their organizations and help inform their contracting discussions. Organizations should consider areas where they may potentially be vulnerable, the outcomes they want to see, and what they want to achieve in the long term.
The table below provides an illustrated example of a payer scorecard. It shows multi-year trends in expected and recognized revenue. Between 2021 and 2024, expected revenue increased by roughly 6% across commercial plans while recognized revenue decreased by 3%. Notably, non-HMO and PPO commercial plans had a significantly higher decrease in expected revenue.*
*Note: The table below shows the average annual trends of expected and recognized revenue from 2021-2024. Download the report to view each individual year in the example payer scorecard.
Example of a payer scorecard
| Totals by coverage type | Average annual trend of expected percentage of repriced Medicare, by payer type, 2021-2024 | Average annual trend of recognized percentage of repriced Medicare, by payer type, 2021-2024 |
|---|---|---|
| Commercial | 6.1% | -3.0% |
| HMO | 5.8% | -5.2% |
| PPO | 5.8% | -3.0% |
| Other | -33.1% | -1.2% |
| Medicare | 0.1% | -0.8% |
| MA | 0.9% | -2.0% |
| CMS | -0.4% | -0.3% |
| Source: An analysis of claims data from a West Coast hospital network. | ||
After analyzing their different payer contracts, leaders can identify potential opportunities to increase revenue.
Below, the table on the left tab shows the current state of an organization’s Medicare Advantage (MA) contracts, specifically reimbursement across different revenue components. It allows leaders to evaluate revenue across different payers.
The table on the right tab details four changes the organization could make to their MA contracts to increase their potential revenue. Overall, these opportunities represent a $20 million increase in potential revenue across three different payers.
Example of reimbursement comparisons in 3 MA contracts across all revenue components
- Current state: Contract revenue analysis
- Future state: Contract revenue opportunity
| Payer A ~45K lives | Payer B ~2K lives | Payer C ~10K lives | Current total ~60K lives | |
| Net MA revenue (% of FFS allowed) | $378M (94%) | $26M (95%) | $72M (96%) | $476M (94%) |
| Quality incentives | $9M | $1M | -- | $10M |
| Shared savings | $4M | ($3M) | ($2M) | ($1M) |
| Total MA revenue (% of FFS allowed) | $391M (97%) | $24M (88%) | $70M (93%) | $485M (96%) |
Net MA Revenue represents the total FFS revenue from each MA payer % of FFS Allowed is calculated by comparing actual revenue to traditional Medicare reimbursement from CMS Source: Optum Advisory Medicare Advantage contracting client use case. | ||||
| Potential increase | Contractual changes | Potential revenue | |
| Net MA revenue (% of FFS allowed) | +$12M | Enter gold card program with Payer A (Eliminates prior-auth for full-risk lives; proj. denials reduction: 3%) | $488M (97%) |
| Quality incentives | +$3M | Add quality incentive payments with Payer C | $13M |
| Shared savings | +$2M
+$3M | Adjust inclusions for Medical Expense for Payer A
Exit downside risk with Payer B | ($4M) |
| Total MA revenue (% of FFS allowed) | +$20M (4%) | $505M (100%) | |
Net MA Revenue represents the total FFS revenue from each MA payer % of FFS Allowed is calculated by comparing actual revenue to traditional Medicare reimbursement from CMS Source: Optum Advisory Medicare Advantage contracting client use case. | |||
After evaluating your competitors and current contracts with payers, you will have a better understanding of how to approach contract negotiations.
For risk-based contracts, providers must ensure alignment with payers on incentive design for financial goals, as well as the behaviors needed to achieve those goals. Instead of variable compensation based on productivity, providers can consider including quality incentives, such as utilization metrics or reduced ED visits, as part of the negotiations.
Providers should also identify what they want from payer partners before entering negotiations. Misaligned expectations or limited data sharing between payers and providers can undermine trust and make the contract negotiation process more difficult.
Key questions organizations should explicitly address include:
- Do my payer partners just want to increase revenue from premiums, or do they also want to decrease costs?
- What kind of risk is being transferred from payer to providers? Are payers willing to work with providers on these risks?
- Are payers passing along risks for things that physicians can't manage? (Ex. high-cost pharmaceuticals)
For more insights into successful plan-provider partnerships, check out these ready-to-use slides.
Why actuarial expertise strengthens payer negotiations
Actuarial support is also a key component of the negotiation process and can help providers level the playing field. While health plans have healthcare economics departments led by actuaries, most provider organizations don't have the same level of expertise — putting them at a disadvantage from the start.
Actuaries can create mathematical models of contracts being proposed so providers can see the flow of the population, potential opportunities, the maximum and minimum amounts available from these opportunities, what kinds of risk is being transferred, and more. Throughout the negotiation process, actuaries can also model the impact of different proposed rate changes and rate structures, including by service categories.
Actuaries can also analyze the language used in contracts and highlight any terms that organizations should be concerned about. For example, does the contract include any material change limits? Does the contract provide payers with control of certain areas? Are payers allowed to force changes to things that are outside of providers' control?
Because actuaries understand the risk and range of possible outcomes associated with a contract, they can help providers understand what components are in their control and protect them from any potentially damaging terms.
Overall, readying both data and actuarial support can help better prepare providers for payer contract negotiations. This will help organizations argue their position and showcase their value to payers more clearly.
Case snapshotA hospital network on the West Coast recently finalized an agreement for a two-year contract with a local health plan. During negotiations, an actuary provided integral analytic support and helped the hospital negotiate more favorable payment rates and terms.
Through the negotiations, the hospital network was able to achieve an overall increase of 19.2% to its payment rates. This increase amounted to $31.8 million for the first year of the contract.
The hospital secured a significant increase to its outpatient emergency payment rates and shifted the payment methodology to a per visit rate for each specific ED level. These changes alone generated $8.1 million in rate increases. Showing the rates proposed as a percent of Medicare as opposed to a percent increase helped the payer understand the need for the increase on these particular services.
Other beneficial changes in the contract include additional payments for both inpatient and outpatient dialysis. Urgent care rates were also increased to be closer to covering direct costs.
By stabilizing FFS reimbursement first, the organization successfully added additional VBC incentives later. According to the hospital network's health plan director, an analytical thought process combined with an understanding of medical claims data provides a unique intersection of experience that is necessary for providers who are taking on risk to have during their contract negotiations. Actuaries, or those with a similar background, can provide crucial support to hospitals and health systems during the negotiation process. |
After a successful contract negotiation, organizations can continue to leverage data to demonstrate the value of their care delivery beyond reimbursement numbers. Organizations can highlight how they compare to competitors or peers and better understand variations in care, including utilization, cost, quality, network retention, and site-of-service comparisons.
A value analysis can help organizations pinpoint their strengths and weaknesses, both at an aggregate and an episodic level, and can help them understand how payers view them compared to other organizations. Consider whether something you're doing is different from everyone else, or if payers prefer your organization for specific reasons.
Some potential ways to demonstrate value to payers include:
- Showing that you manage procedures or episodes that other hospitals in your area don’t
- Having lower utilization rates for certain populations
- Offering specific referral patterns for specialty care
- Providing effective care in specific categories, like cardiology or oncology
This information allows organizations to more accurately identify where they should maintain their current processes, where they should allocate their limited care management resources, and opportunities for growth. Longitudinal claims data can also help organizations evaluate and demonstrate the effectiveness of care management programs that are foundational to value-based care.
Conclusion
In recent years, providers have faced mounting pressure from declining FFS reimbursement, increased denials, and new prior authorization requirements — increasing the need to transition to VBC models to ensure margin sustainability. An uneven playing field between providers and payers makes it more difficult for providers to maximize the value of their contracts, ultimately leading them to face higher performance risks and miss out on potential revenue.
VBC program evaluation is necessary step in participation, to be able to measure the outcomes in terms that align with the contract and accurately determine drivers behind the measurement — whether it’s certain providers that improved, types of utilization that were avoided, or large-scale site of service shifts.
Being able to compare data pre-and post-participation on a population can help support the ROI of interventions, identify favorable trends in changed utilization, and enable organizations to put their limited resources towards the interventions that will produce the most overall value for the organization.
This holistic, analytically grounded approach positions providers to negotiate from strength and sustain long-term performance.
1 Jain R, et al. VBC contracting: 3 keys to a successful plan-provider partnership. Advisory Board. November 5, 2025.
2 Jain R, Wirth C. Your guide to VBC contracting levers. Advisory Board. November 5, 2025.


Don't miss out on the latest Advisory Board insights
Create your free account to access 1 resource, including the latest research and webinars.
Want access without creating an account?
You have 1 free members-only resource remaining this month.
1 free members-only resources remaining
1 free members-only resources remaining
You've reached your limit of free insights
Become a member to access all of Advisory Board's resources, events, and experts
Never miss out on the latest innovative health care content tailored to you.
Benefits include:
Unlimited access to research and resources
Member-only access to events and trainings
Expert-led consultation and facilitation
The latest content delivered to your inbox
This content is available through your Curated Research partnership with Advisory Board. Click on ‘view this resource’ to read the full piece
Email ask@advisory.com to learn more
Click on ‘Become a Member’ to learn about the benefits of a Full-Access partnership with Advisory Board
Never miss out on the latest innovative health care content tailored to you.
Benefits Include:
Unlimited access to research and resources
Member-only access to events and trainings
Expert-led consultation and facilitation
The latest content delivered to your inbox
This is for members only. Learn more.
Click on ‘Become a Member’ to learn about the benefits of a Full-Access partnership with Advisory Board
Never miss out on the latest innovative health care content tailored to you.
Benefits Include:
Unlimited access to research and resources
Member-only access to events and trainings
Expert-led consultation and facilitation
The latest content delivered to your inbox