Auto logout in seconds.
Continue Logout
Methodology
We analyzed inpatient surgical claims data sourced from CMS Standard Analytical Files (SAFs) which represent fee-for-service (FFS) facility claims for hospitals across the U.S. We looked at the time period of Q2 2021 to Q1 2022.
Reimbursement and contribution profit data were sourced from Advisory Board’s Hospital Benchmark Generator. Volume and forecast data was sourced from Advisory Board’s Market Scenario Planner.
To analyze propensity for travel, we compared patient origin to the location of the provider facility where care was delivered for each claim. We aggregated the data into hospital referral regions, as defined by Dartmouth Atlas.
Research questions
We posed three key research questions for this analysis:
- For which surgeries is out-of-market travel most common among Medicare beneficiaries?
- How successful are brand name systems at capturing out-of-market volume compared to typical patterns nationwide?
- Is surgical travel more common in certain regions of the country?
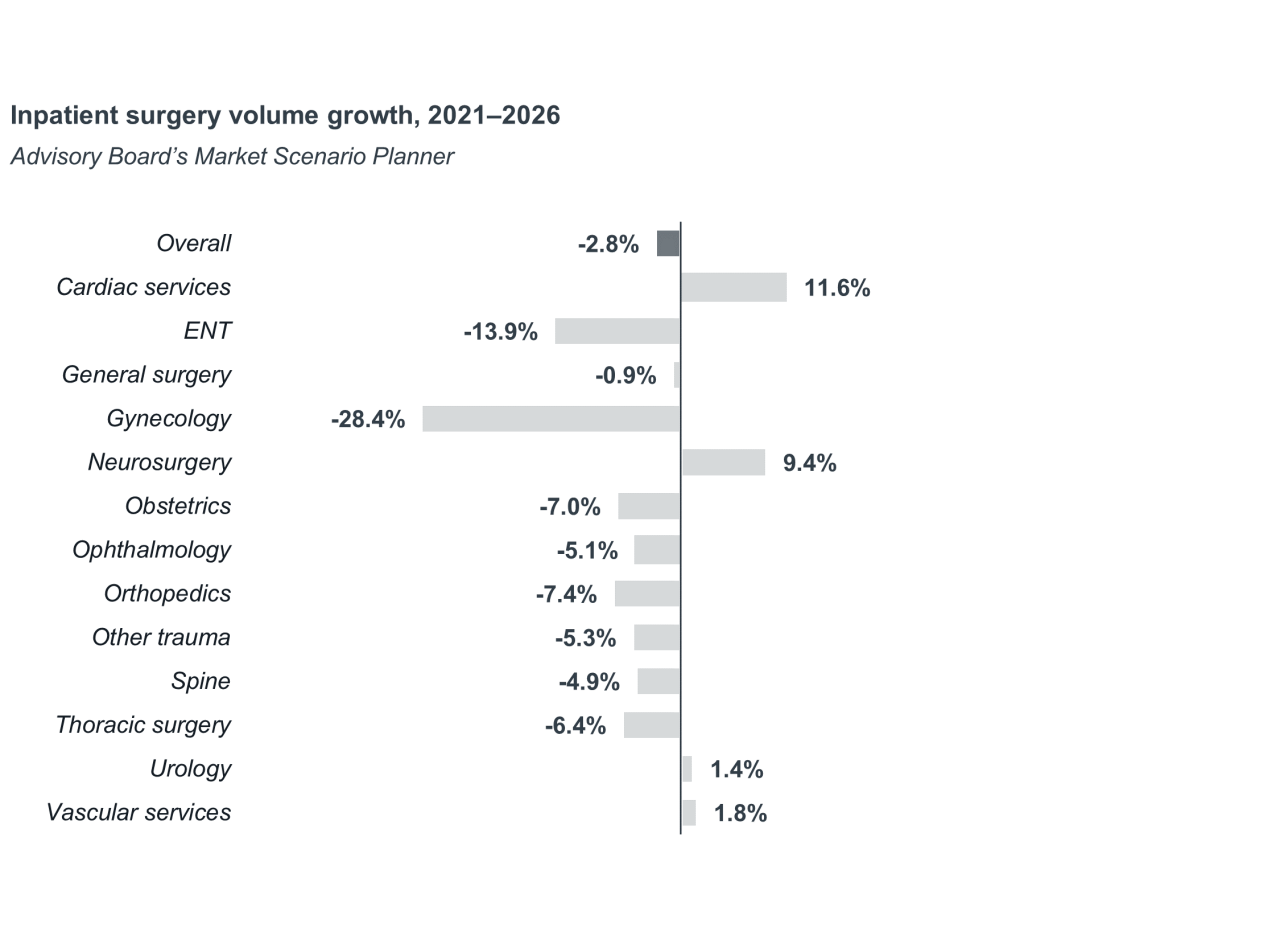
Advisory Board projects a nearly 3% decline in inpatient surgical volumes from 2021 to 2026. While shifts to the outpatient setting are not a new trend, recent payment and regulatory changes have created expanded opportunities in key, high-volume hospital service lines such as orthopedics and spine.
In the face of shrinking surgical volumes, hospitals have two options to achieve continued inpatient surgical growth. One, they could expand services in the few service lines with high inpatient growth expectations such as neurosurgery. Or two, they could expand their catchment area and become a destination site of care.
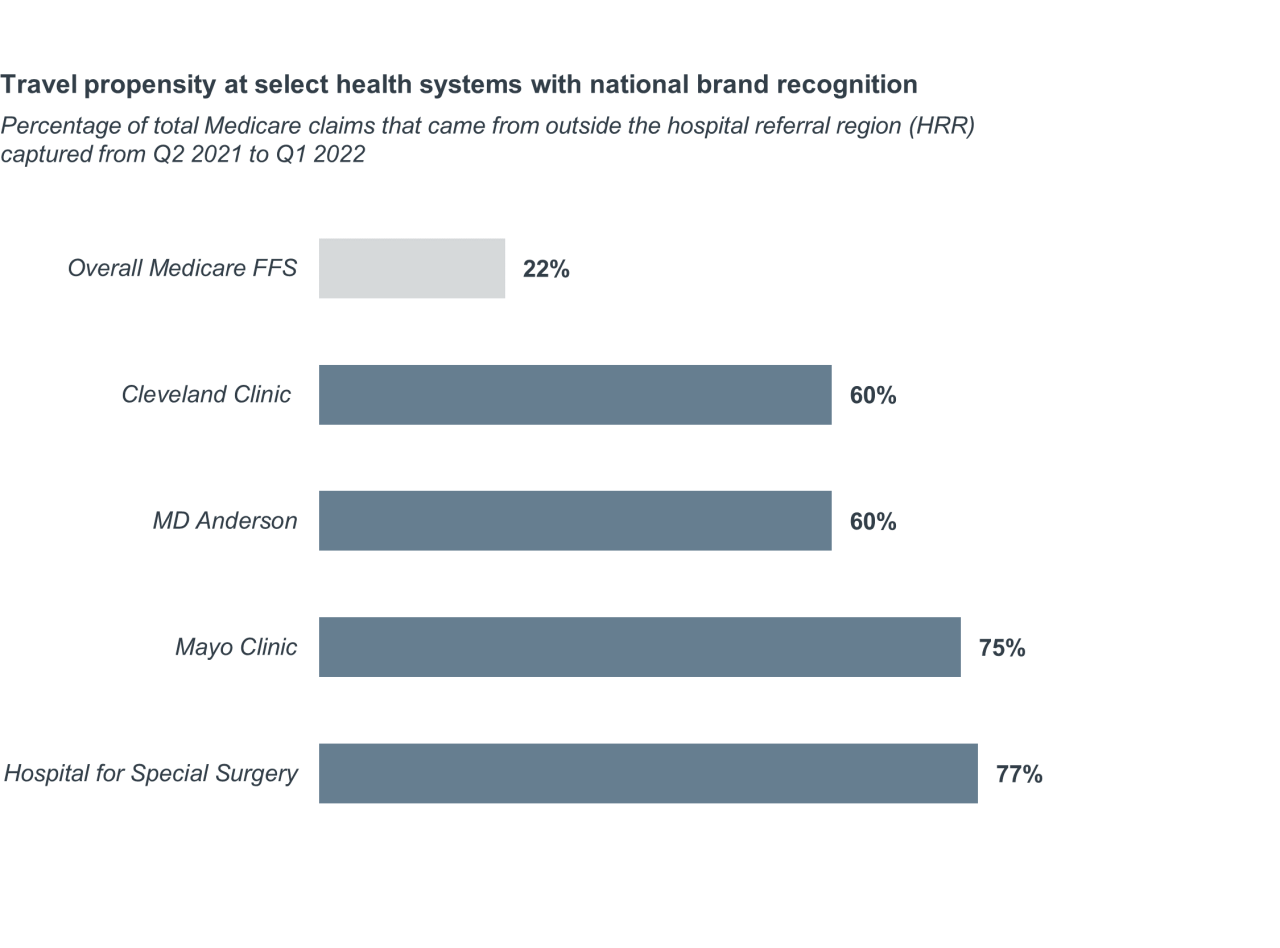
Out-of-market travel for surgical care isn’t uncommon. Between Q2 2021 and Q1 2022, 22% of inpatient Medicare fee-for-service (FFS) surgical claims were attributed to patients who traveled outside of their region for care.
Propensity for travel is much higher for health systems with national brand recognition. In fact, all of the eight brand name systems Advisory Board analyzed – Cleveland Clinic, Duke Health, Hospital for Special Surgery, Johns Hopkins, Mayo Clinic, MD Anderson, Memorial Sloan Kettering, and Virginia Mason – received the majority of their inpatient surgical volume from patients outside their own hospital referral region.
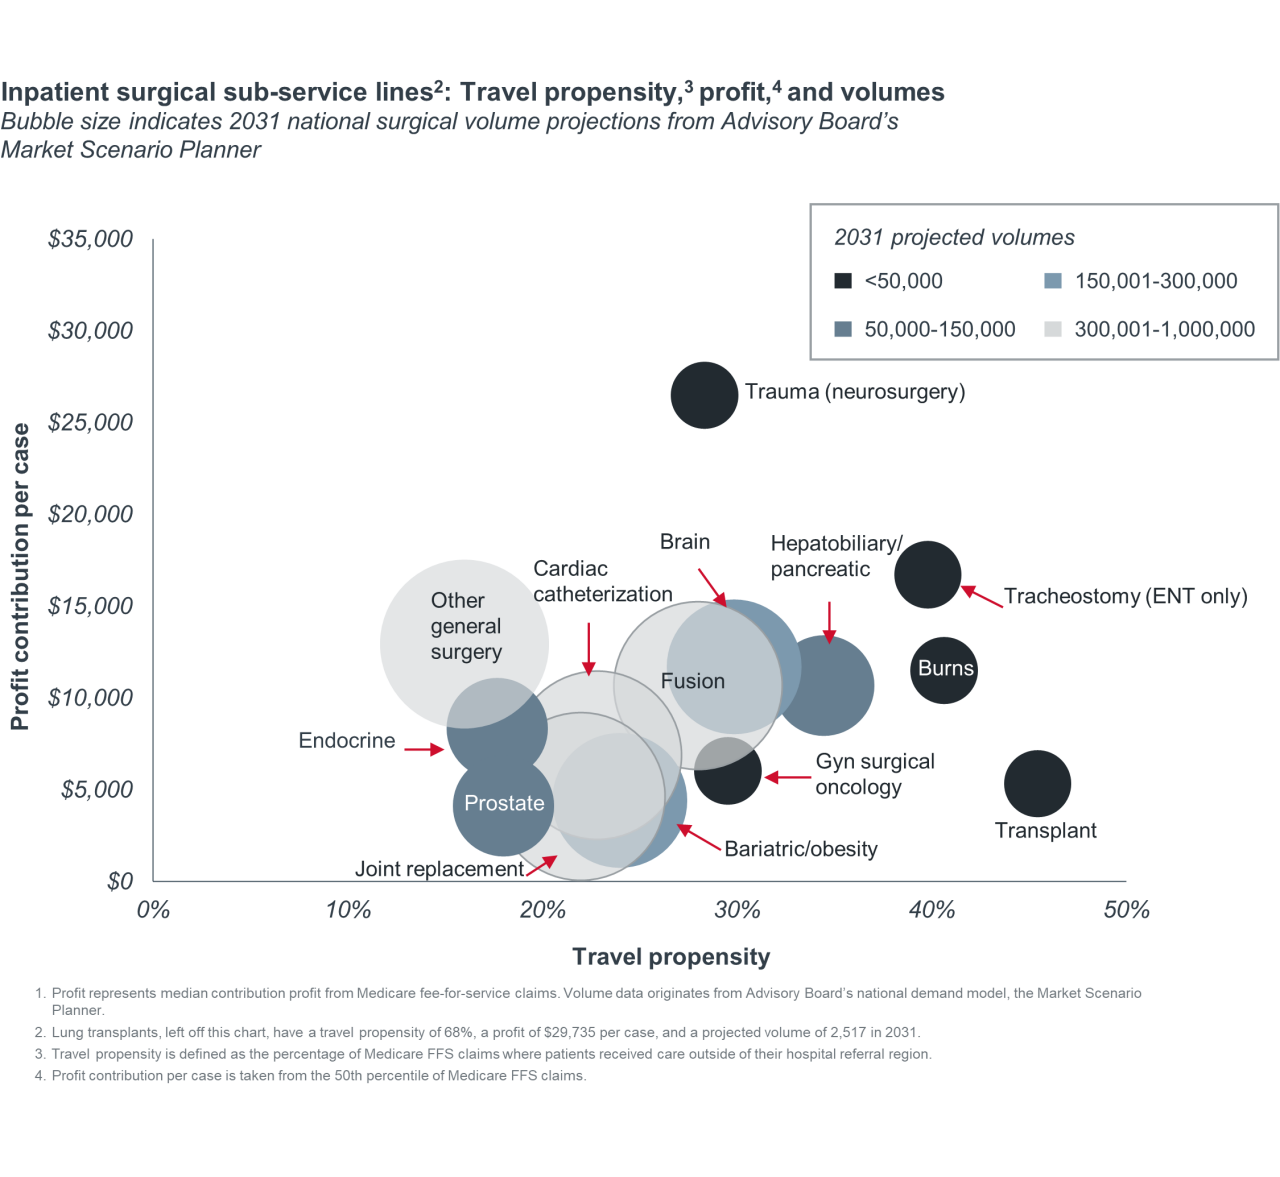
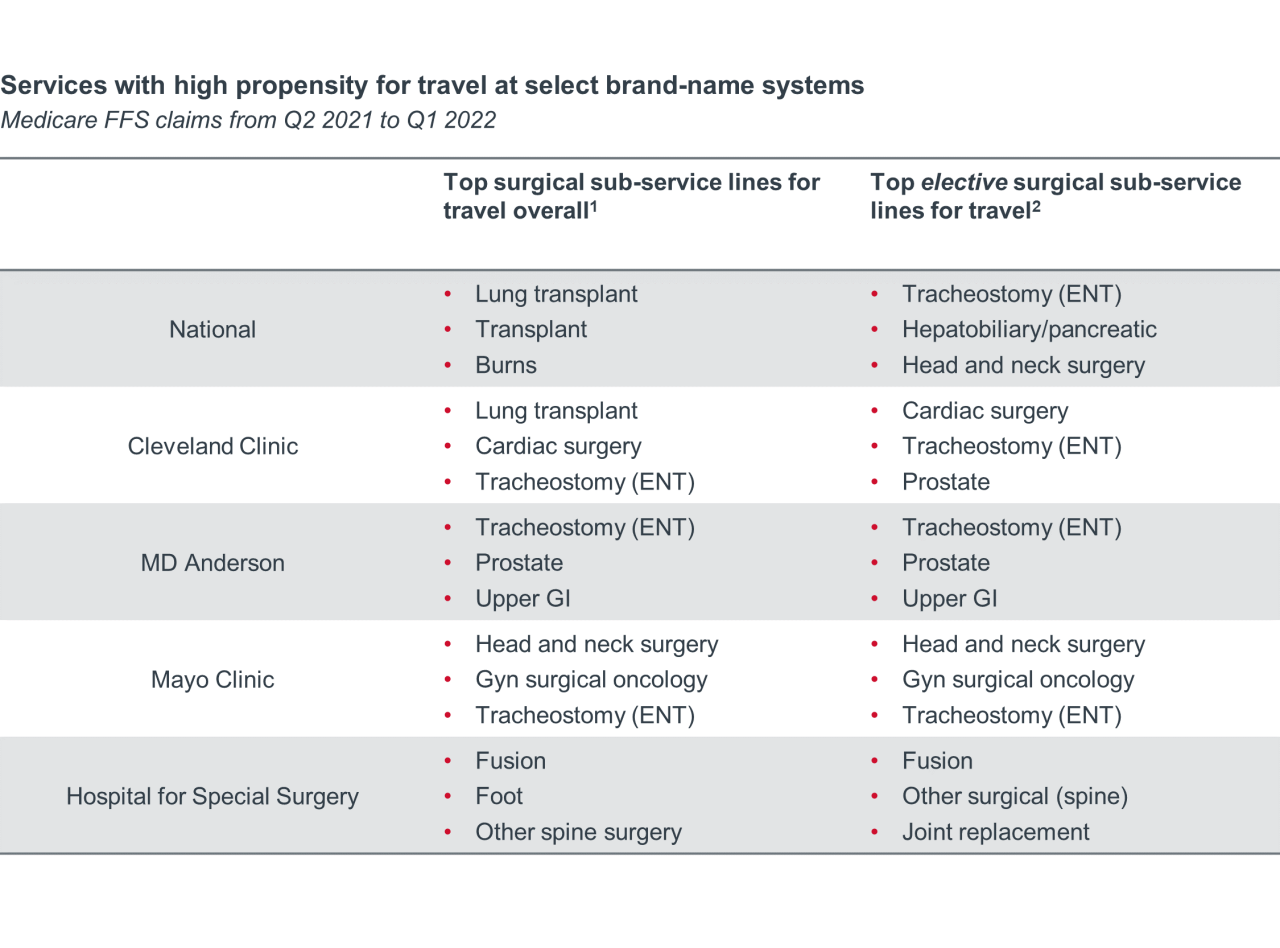
Out-of-market travel can occur because the service isn’t available locally or because there is an active choice to receive care elsewhere. We found that the services with the highest propensity for travel are ones that are not available at every hospital (e.g., transplant) or delivered only at specialized locations (e.g., burns). On average, the top sub-service lines (SSLs) for travel are low-volume, high-profit services.
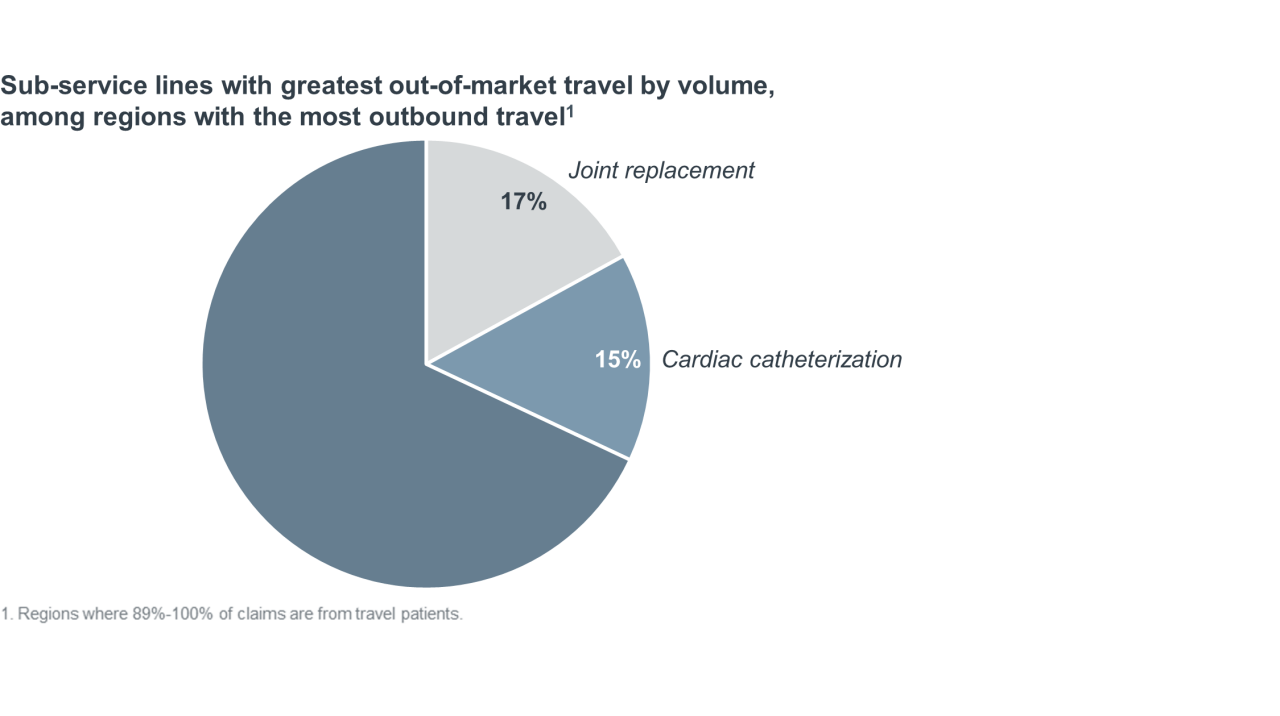
By volume, joint replacement and cardiac catheterization account for 32% of claims delivered out-of-market. Approximately 88% of joint replacements are classified as pre-scheduled, elective procedures, making them highly susceptible to out-of-market volume loss or capture due to patient choice. By comparison, just 16% of cardiac catheterization procedures are elective.
To better isolate travel cases likely to be motivated by patient choice, we examined the services making up the out-of-market business for brand-name systems. We found the surgeries that patients travel to brand-name systems for the most were generally more elective than surgeries traveled for overall. Common elective sub-service lines for travel at brand names include head and neck surgery, ENT tracheostomy, fusion, and prostate surgeries.
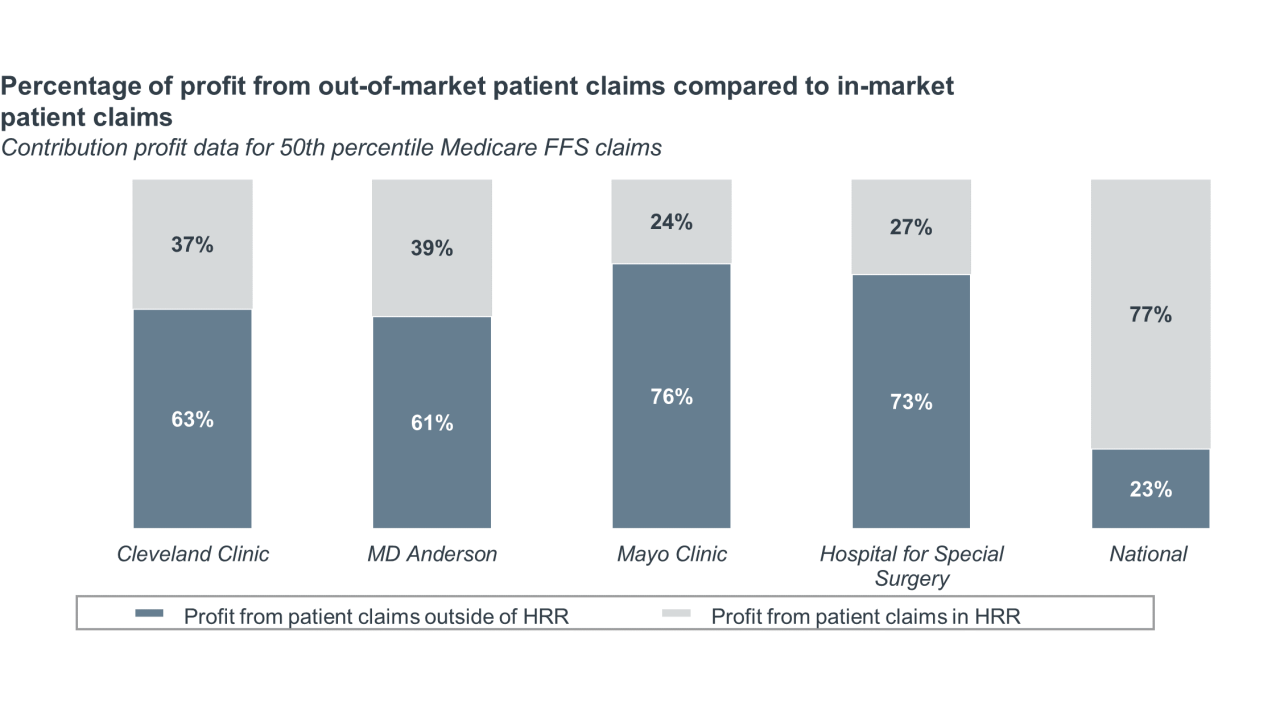
According to Advisory Board’s Hospital Benchmark Generator, profits from out-of-market travel cases make up 23% of total profits nationally, but at brand-name systems, travel claims make up the vast majority of profits. For instance, at Mayo Clinic, three-fourths of profits come from out-of-market patients. While travel patients make up a large percentage of total inpatient surgical claims, this data demonstrates that these claims are also highly profitable for health systems.
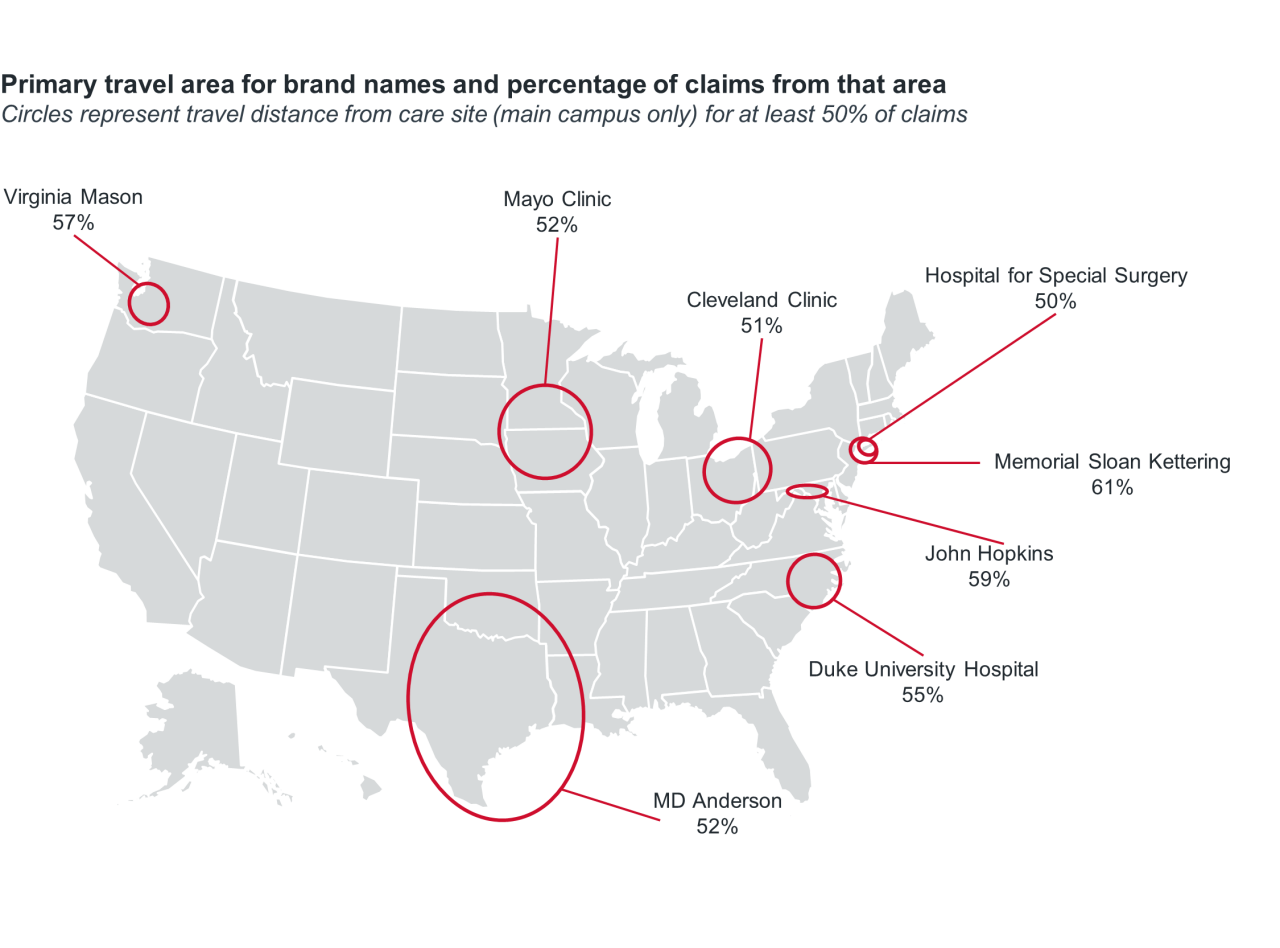
Patients tend to stay close to home, even when traveling for care. The average distance traveled by patients from the 10 regions with the highest propensity for travel was 44 miles.
Even brand-name hospitals attract most out-of-market patients from nearby regions. As shown below, most out-of-market volume for brand-name systems comes from their home state. For brand-name hospitals, the average distance traveled by patients from the top five inbound regions, representing as much as 75% of a brand-name hospital’s claims, was 93 miles.
93
Average number of miles between brand-name hospitals and their top five inbound regions (representing 24% to 75% of all travel volume)
This finding means the opportunity to attract travel patients is a matter of proximity, not just branding alone. A hospital’s biggest competitors might not be national brand names, but rather the destination centers a few hours away.
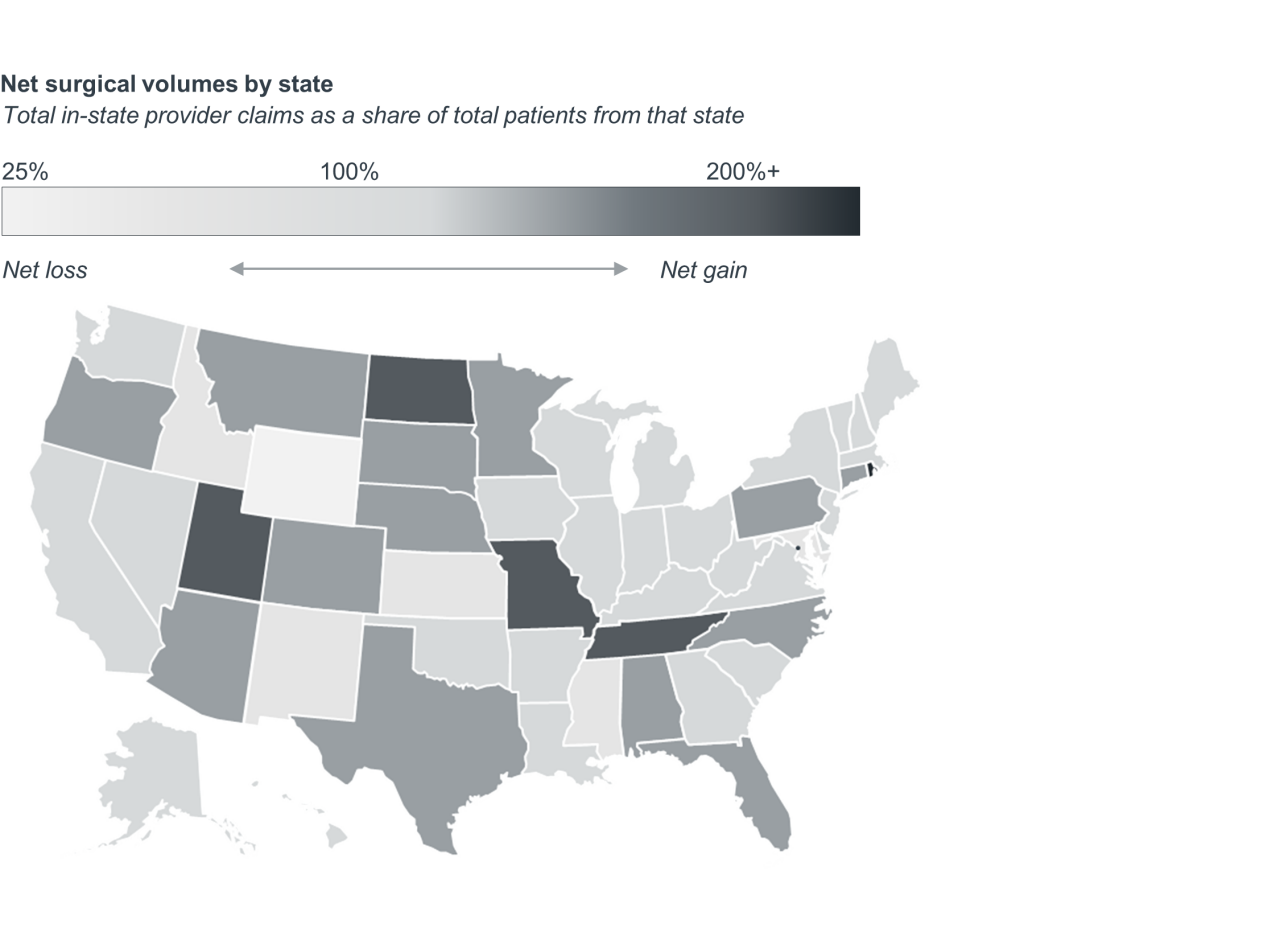
Attracting travel patients is a game of winners and losers. But it doesn’t appear that any one state has a leg up when it comes to their ability to attract out-of-market patients. As shown below, most states are “retainers.”
- Retainers: These states lose and gain few patients on a net basis. Attracting in-state patients is the most likely route for expansion.
- Attractors: Providers in these states have a net gain in volume due to travel. Growth depends on the ability to expand market share across a wide service area.
- Losers: Providers in these states have a net loss in volume due to travel. These states should identify the service lines and regions from which they are losing the most patients.
These findings underscore both the importance of attracting out-of-market patients and retaining patients locally. Even if your institution is not a marquee name, there are actions you can take to preserve or grow your market share. Review our starter list below and further resources to develop and implement a successful strategy.
- Develop a retention metric to track performance over time. Ultimately, your goal should be to surface drivers of choice, loyalty, and activation for services where you are losing volume to competitors outside your market. But data is a first step to get attention from executive teams and focus efforts of your service line leaders.
- Establish centers of excellence for a select number of service lines where your institution excels. Narrow your ambitions of becoming a destination center to two to three service lines where volume is high and outcomes are consistent. If you’re losing patients due to perceived, rather than actual, differentials in quality and outcomes, explore clinical affiliations to “reset” your reputation among local patients and referring physicians.
- Develop regional networks with realistic catchment areas. Patients who travel for surgery most commonly travel 40 to 50 miles from their home location. You may experience diminishing returns when investing marketing dollars, devoting personnel for physician education, and establishing “spoke” facilities beyond a 60-to 90-minute drive to your hub facility.
- Create journey maps to identify opportunities to enhance the patient experience across surgical episodes. To reduce the friction associated with travel and promote word-of-mouth referrals, consider offering concierge services, such as arranging for travel and lodging, scheduling appointments in succession, and handling transfer of medical information.
- Build collaborative care models with referring specialists and PCPs. A highly specialized and differentiated clinical product caters to the needs of referring physicians. Consider ways to more closely integrate with referral sources, before and after surgery. For example, offer on-demand consults to identify surgical candidates and provide visit summaries, a description of the care plan, and any outstanding follow-up tasks for the referring physician and patient after the surgery.
- Scan the market for direct contracting opportunities. The trend toward self-insurance may give employers new motivation to consider bundled payment programs that provide financial incentives to employees if they use certain providers. Sophisticated employers will look for high-spend services with a high degree of repeat surgeries, misdiagnoses, and price variation.

Elizabeth Orr
Senior research analyst, Health systems research

Posted on July 20, 2023
Updated on December 29, 2023
Don't miss out on the latest Advisory Board insights
Create your free account to access 1 resource, including the latest research and webinars.
Want access without creating an account?
You have 1 free members-only resource remaining this month.
1 free members-only resources remaining
1 free members-only resources remaining
You've reached your limit of free insights
Become a member to access all of Advisory Board's resources, events, and experts
Never miss out on the latest innovative health care content tailored to you.
Benefits include:
Unlimited access to research and resources
Member-only access to events and trainings
Expert-led consultation and facilitation
The latest content delivered to your inbox
This content is available through your Curated Research partnership with Advisory Board. Click on ‘view this resource’ to read the full piece
Email ask@advisory.com to learn more
Click on ‘Become a Member’ to learn about the benefits of a Full-Access partnership with Advisory Board
Never miss out on the latest innovative health care content tailored to you.
Benefits Include:
Unlimited access to research and resources
Member-only access to events and trainings
Expert-led consultation and facilitation
The latest content delivered to your inbox
This is for members only. Learn more.
Click on ‘Become a Member’ to learn about the benefits of a Full-Access partnership with Advisory Board
Never miss out on the latest innovative health care content tailored to you.
Benefits Include:
Unlimited access to research and resources
Member-only access to events and trainings
Expert-led consultation and facilitation
The latest content delivered to your inbox