Auto logout in seconds.
Continue LogoutAdvisory Board’s research estimates an approximate $100 billion annual national cost savings opportunity stemming from unwarranted care variation. Recent policy shifts and changes to traditional funding streams are exacerbating pressures on health systems at a time when rising costs and ageing patient populations are already upending health systems’ business and care delivery models. Most organizations have already tapped out traditional cost savings strategies and are now looking for ways to simultaneously reduce costs and enhance operational efficiency without compromising care quality.
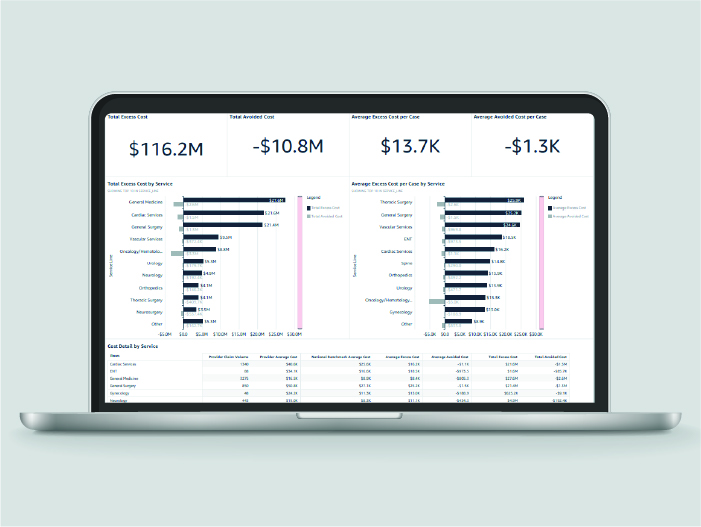
Addressing unwarranted clinical care variation enables organizations to achieve cost savings at scale, reduce length of stay (LOS), improve outcomes, and enhance patient and staff experience. To help medical, operational, and service line leaders identify the biggest opportunities within their organization, Advisory Board developed the Care Variation Reduction Assessment. The tool estimates direct costs per case for every Traditional Medicare admission and compares cost and LOS performance for your selected facility cohort against a national or custom cohort.
This tool equips organizations with actionable data to break the next frontier of cost management and operational efficiency.
Why use the Care Variation Reduction Assessment tool
- Size cost and length of stay opportunity: The tool quantifies excess costs and excess LOS at the facility, service line, subservice line, Medicare Severity Diagnosis Related Groups (MS-DRGs), and physician level.
- Benchmark performance: Compare your cost and LOS performance against national benchmarks or against a custom cohort of selected hospitals.
- Target outliers: By drilling down to the subservice line and physician levels, organizations can narrow their focus and target interventions toward the sources of variation that have outsized impacts on facility-level cost and quality performance.
- Leverage data to engage clinical teams: The tool quantifies total avoided costs and total avoided LOS to help identify high performing individual physicians and exemplars within your organization.
- Track performance over time: Organizations can track their excess cost and LOS performance over the past five years by using the data visualization features built into the tool.
What the data tells us1
- Hospitals can save up to $780 million and 80,000 bed days annually. According to our analysis, providers across all regions and bed sizes with excess costs can save between $9,700 and $780 million annually. The same analysis for excess LOS reveals that providers can reduce LOS by anywhere from 298 to 80,000 bed days annually.
- The average cost savings opportunity for hospitals is $11.8 million. The national total cost savings opportunity for Medicare FFS averages out to $11.8 million across all short-term hospitals with volumes of more than 1,000 patients.
Average cost savings opportunity for hospitals with 1,000+ beds
- The bigger the hospitals, the bigger the average cost savings and length-of-stay reduction opportunity. When comparing cohorts of hospitals by bed size across all regions, hospitals with over 1,000 beds have the greatest average excess costs and greatest average excess LOS. Average excess cost for hospitals with over 1,000 beds is $58.9 million and average excess length of stay is 20,000 bed days. Conversely, hospitals with fewer than 200 beds have the lowest average cost savings and LOS reduction opportunity, standing to save an average of $4 million and 2,000 bed days annually.
- Hospitals in the Northeast have the biggest length-of-stay reduction opportunity on average. Compared across the Northeast, Midwest, South, and West, hospitals in the Northeast — which includes 333 hospitals across New England and the Midatlantic — collectively have an average excess LOS of 6,900 bed days annually. Hospitals in the Midwest, South, and West have an average LOS opportunity of 4,100, 5,000, and 4,400 days, respectively.
- Hospitals in the West, on average, have the biggest cost savings opportunity. Compared across the same four regions, hospitals in the West — which includes 371 hospitals across Mountain and Pacific regions — collectively have an average cost savings opportunity of $19.8 million. Hospitals in the Northeast, Midwest, and South have an average cost savings opportunity of $16.4 million, $7.5 million, and $7.9 million, respectively.
Where to go from here
1 According to an analysis of 1,820 short-term (active provider) hospitals with volumes >1000 patients using Medicare FFS data from Q1-Q4 2024: Care Variation Reduction Assessment.
Don't miss out on the latest Advisory Board insights
Create your free account to access 1 resource, including the latest research and webinars.
Want access without creating an account?
You have 1 free members-only resource remaining this month.
1 free members-only resources remaining
1 free members-only resources remaining
You've reached your limit of free insights
Become a member to access all of Advisory Board's resources, events, and experts
Never miss out on the latest innovative health care content tailored to you.
Benefits include:
You've reached your limit of free insights
Become a member to access all of Advisory Board's resources, events, and experts
Never miss out on the latest innovative health care content tailored to you.
Benefits include:
This content is available through your Curated Research partnership with Advisory Board. Click on ‘view this resource’ to read the full piece
Email ask@advisory.com to learn more
Click on ‘Become a Member’ to learn about the benefits of a Full-Access partnership with Advisory Board
Never miss out on the latest innovative health care content tailored to you.
Benefits Include:
This is for members only. Learn more.
Click on ‘Become a Member’ to learn about the benefits of a Full-Access partnership with Advisory Board
Never miss out on the latest innovative health care content tailored to you.


