Auto logout in seconds.
Continue Logout
The healthcare workforce is showing signs of stability nationally, but rising patient volumes are straining capacity unevenly across regions and bed sizes. Health systems must adopt innovative staffing models and leverage technology, including AI, to improve workload and efficiency.
Overall, our 2025 analysis points to workforce stability. Turnover rates, particularly for nursing, remain consistent but high. Structurally and over time, there is cause for concern because head count is flat to declining and volume and wages continue to rise. This results in higher workforce budgets with less staff. Cumulatively, that puts pressure on margin, productivity, and most importantly staff workloads.
In this report, you will find data on employee head count, turnover, and span of control, as well as our take on what next steps your organization should take to prepare for future staffing needs.
The benchmarks in this report are intended to provide directional guidance to evaluate hospital performance against national-level data. This report also includes breakouts for region and bed size, as available, allowing for more granular comparisons. We’ve included key takeaways and select graphs.
Benchmarking is one of many ways that organizations can assess performance. Benchmarks should not be seen as an absolute standard or used to determine an exact target. Rather, they demonstrate where a hospital sits in relation to others and highlight where opportunities exist. Staffing benchmarks should be evaluated in conjunction with other interrelated measures, including financial performance, colleague engagement, quality metrics, and patient satisfaction, when developing an organizational strategy.
Methodology
We developed this report using data from Strata Market Insights,1 which is sourced directly from business systems at more than 1,600 hospitals. Unless specifically noted, all data in this report comes from Strata Market Insights. The volume benchmarks are at the “entity facility” level, which is an aggregate at the individual “building” or facility level.
Unless otherwise noted, we report data from the full 2025 calendar year.
We used Strata Market Insights’ definitions for functional groups, roles, ratios, and turnover.
- Functional groups: Functional groups combine similar departments or units. For example, “food and nutrition” includes staff employed in cafes, shops, cafeterias, and other food retail; patient food services; and patient food services combined with retail.
- Role: Roles include staff, supervisor, manager, director, and executive. Staff titles include all staff except for physicians, advanced practice providers (APPs), supervisors, managers, directors, and executives. Supervisors include titles such as charge nurses, executive chefs, clinical (nursing, respiratory therapy, pharmacy, etc.), and nonclinical supervisors (patient access, sterile processing, supply chain, etc.). Managers and directors include clinical and nonclinical titles. Executive roles are inclusive of chief officer and vice president titles.
- Ratios: Ratios do not imply direct reporting structure. Ratios are determined by calculating the total number of employees in a role by the total number of employees in a role within the same cohort. For example, all hospital staff-to-supervisor ratios are the total hospital employee head count divided by the total number of supervisors at the hospital.
- Turnover: Turnover is based on payroll data. If a staff member drops off payroll for four months in a row, we assume they have left the organization. Turnover represents the number of staff removed from the payroll divided by the total number at the entity. Because Strata Market Insights captures this number as a monthly measure, we approximate an annual median by totaling monthly meetings. Turnover is also calculated on a delayed time frame compared to the other metrics (October 2024 through September 2025) to prevent accidental capture of staff temporarily off payroll.
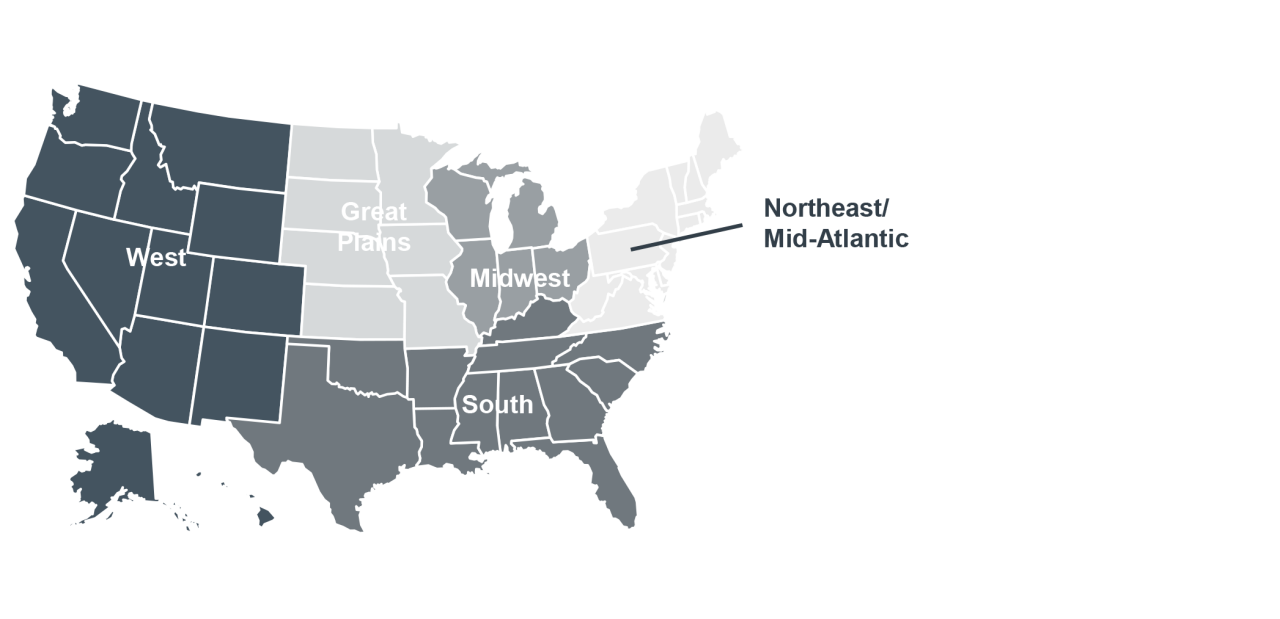
Regional division: Below is a map of how Strata Market Insights defines each geographical region.
Key takeaways
Workforce turnover held steady at 18% in the most recent period and was remarkably consistent across bed sizes and geographical regions. The notable exception is in the West, where median turnover rates remain below the all-hospital median for two consecutive years. The West, most specifically the west coast, has more rigorous labor laws than other regions, including higher minimum wage and nurse-to-patient ratios, which may contribute to lower turnover.
Nationally, median turnover within nursing departments is more than double that of the hospital overall. This holds true for all regions. One thing to keep in mind when examining this data: In this dataset, nursing turnover includes all roles within nursing, including RNs, LPNs, and CNAs. This is important to note because nursing support roles have a higher rate of turnover than registered nurses, which is why this number is higher than we normally see reported for nursing turnover.
Our take
While turnover has remained stable in the workforce overall, it remains highest for the roles closest to the bedside. Recruiting and retaining nursing and support roles in acute care continues to be challenging, as bedside nursing staff face workplace violence, incivility, and unsustainable workloads. A recent Advisory Board survey found that only 36% of nurses in bedside roles still plan to be working at the bedside in three years. So even though turnover held steady from 2024 to 2025, the long-term stability of the nursing workforce is eroding. As a result, retention is critical for workforce sustainability and will require leaders to double down on efforts to improve the work environment and make bedside roles more attractive to nurses across their careers.
Address root causes of workforce instability
Reducing turnover has been an ongoing priority for health systems for years. While we can’t back down on traditional retention efforts, it’s important to understand the root causes of turnover and increase support provided to staff. Leaders should:
- Understand key factors driving instability and implement strategies to address them.
- Create engaging career pathways that appeal not only to early career, but to all tenures.
- Implement strategies to prevent early turnover by uncovering discontent before it’s too late.
We observe wide variation in span of control across the percentile rankings. This dataset includes all hospital types from critical-access hospitals to academic medical centers, which likely contribute to the spread from the 10th to 90th percentile. Additionally, there are differences in how roles are defined and how reporting structures are arranged among the reporting hospitals. For example, not all hospitals will have supervisors for every department, and some hospitals may have managers who report directly to a chief executive instead of a director. These individual hospital characteristics will impact span-of-control calculations across the various levels of leadership.
The median ratio of staff and supervisors to manager head count ranges from 9.5 for over 500 beds to 20.4 for 300–499 beds. Hospitals with less than 100 or more than 500 beds have the lowest span of control.
Span of control also varies across the regions, with the West having the overall lowest median span of control ratios and the Northeast/Mid-Atlantic and South having the highest span of control.
Across the different functional groups, nursing has the highest span of control across all bed sizes. The nursing functional group, which includes all staff employed in all nursing departments at a hospital, also shows the largest variation between bed size cohorts, especially with median staff-to-supervisor head count ratios more than doubling in hospitals with 200 beds or more.
It is important to note that larger organizations often have additional roles that support nurses and nurse leaders, such as educators, resource nurses, or clinical nurse specialists, who are not represented as supervisors or managers in this data. This could make clinical leadership roles at large hospitals appear less prevalent than they are. In smaller organizations, these roles are either not present or may function across multiple units, leaving the nurse supervisor or manager to shoulder more responsibility.
Nursing functional groups consistently show the highest span of control regardless of region, with the exception of the West.
Our all-hospital nursing department-level analysis shows variation in span of control across the acute care unit types. These department-level ratios are by full-time equivalent (FTE).
Our take
Leaders can use span of control as a valuable measure of leader workload. However, national data does not clearly account for variation in reporting structures and role definitions between hospitals. While span of control can serve as a valuable metric, it should not be the only consideration when evaluating leadership capacity. Presence of leadership support roles, experience of the leader, tenure of the staff, and complexity of the environment are all factors that impact a leader’s capacity beyond span of control.
Regardless of how span of control is measured, leader workload is an essential consideration for all health system executives. If leaders are spread too thin, they are unable to focus on key strategic priorities that frontline leaders are well positioned to impact, such as staff retention and patient experience. Leadership can be the difference between an efficient, effective department and one that struggles — and organizations often overlook leadership in conversations about staffing challenges.
Support your leaders so they can support your organization
Leaders are critical to organizational performance. Executives must equip them for success, even beyond span of control. This looks like:
- Understanding why nurse leaders are leaving and what to do about it.
- Equipping leaders with the skills to lead in volatile, uncertain times and foster a culture that builds resilient, adaptive leaders.
- Working with your leaders to understand how they feel about their workload and employ strategies to make it more manageable.
1 Certain data in this study were supplied by Strata Decision Technology, LLC (“Strata”). Any analyses, recommendations or advice based on these data are solely that of the author(s) and not Strata.


Posted on June 22, 2026
Don't miss out on the latest Advisory Board insights
Create your free account to access 1 resource, including the latest research and webinars.
Want access without creating an account?
You have 1 free members-only resource remaining this month.
1 free members-only resources remaining
1 free members-only resources remaining
You've reached your limit of free insights
Become a member to access all of Advisory Board's resources, events, and experts
Never miss out on the latest innovative health care content tailored to you.
Benefits include:
Unlimited access to research and resources
Member-only access to events and trainings
Expert-led consultation and facilitation
The latest content delivered to your inbox
This content is available through your Curated Research partnership with Advisory Board. Click on ‘view this resource’ to read the full piece
Email ask@advisory.com to learn more
Click on ‘Become a Member’ to learn about the benefits of a Full-Access partnership with Advisory Board
Never miss out on the latest innovative health care content tailored to you.
Benefits Include:
Unlimited access to research and resources
Member-only access to events and trainings
Expert-led consultation and facilitation
The latest content delivered to your inbox
This is for members only. Learn more.
Click on ‘Become a Member’ to learn about the benefits of a Full-Access partnership with Advisory Board
Never miss out on the latest innovative health care content tailored to you.
Benefits Include:
Unlimited access to research and resources
Member-only access to events and trainings
Expert-led consultation and facilitation
The latest content delivered to your inbox