Auto logout in seconds.
Continue LogoutTo get ahead of costly staff turnover, leaders need to take a more proactive approach—ideally, predicting turnover before it happens.
We recently spoke with leaders from Aurora Health Care, a 15-hospital system headquartered in Milwaukee, Wis., about how the organization invested in a data and analytics team to take a more proactive approach to managing their workforce. The team created an algorithm using several variables and attributes of current and past employees to calculate individual employees’ risk of leaving the organization. We spoke with:
- Troy Dennhof, SVP HR, Aurora Health Care
- Chirag Padalia, Director Workforce Analytics and Strategy, Aurora Health Care
Read on to learn more about their organization's approach to predictive workforce analytics, including:
- Making the business case for investing in predictive analytics
- Modeling employee flight risk
- Overcoming barriers for shifting to predictive analytics
- What's next for Aurora's workforce analytics team
Making the business case for investing in predictive analytics
Advisory Board: Aurora invested in a director-level FTE to build out and lead a workforce data and analytics team. What was the impetus behind that investment, and how did you make the business case for it?
Troy: About three years ago, we set the goal to become an employer of choice. That meant pivoting HR away from being process-based and reactive. We needed to be proactive in our people strategy, including in attracting and retaining talent—and that required elevating our workforce analytics capabilities. That led us to hiring Chirag. We looked at it as a minimal investment; we were re-purposing a head count, and it was relatively low risk.
The business case revolved around the wide variety of organizational needs that workforce analytics could help us inflect. Of course turnover is expensive and that’s a business case in itself, but there were other needs beyond just predicting turnover, such as workforce planning, optimizing staffing models, and using data to bolster talent acquisition.
Chirag: Additionally, when I got to Aurora, there was relatively minimal investment required. Aurora’s IT department already had a large data warehouse, so they were able to carve out a bit of space for me to create a data mart. I began by building an intern program out of a local university, Marquette University, which allowed me to hire relatively inexpensive labor to help build out our workforce analytics capabilities. From there, it was all about getting the quick wins and showing that we were gaining traction against those different organizational needs that Troy described.
AB: You mentioned that Aurora is using predictive analytics to inform your organizational goals. Can you give an example of how that’s manifested itself?
Troy: The two actually go hand in hand; we can customize how we approach workforce analytics based on our organizational goals, and our workforce analytics helps us shape our goals. For example, since one of Aurora’s organizational priorities is increasing diversity and inclusion, we approach workforce analytics through the lens of diversity and inclusion.
If a certain ethnic group makes up X% of our overall workforce, we’d expect to see that same proportion reflected similarly for employee turnover. If the proportion is much larger—we know we have a problem. We can use our workforce analytics to focus our efforts in a way that seeks to drive parity across the organization.
At the same time, workforce analytics helps us shape our goals throughout the organization. When setting turnover (and other) targets previously, we’d use benchmarks for the local and national markets—and we’d set these targets at the system level. Since building our workforce analytics capabilities, we are able to set targets by location—and these targets are much more effective and realistic because they are based on historical data.
Modeling employee flight risk
AB: One of the main ways Aurora is using predictive analytics is through a flight risk model that predicts the flight risk of in-seat employees. How does the flight risk model work?
Chirag: The flight risk model is an algorithm that uses several variables to quantify and predict individual flight risk of all current employees. Drawing on a wide range of data from current and past employees, the model gives a probability percent for who’s at risk of leaving the organization over the next six months (based on the characteristics of those who have already left). Each individual employee has a risk number attached to them. My team works with HR business partners and operational leaders to use the output of the flight risk model to inform retention interventions.
AB: What factors go in to the flight risk model?
Chirag:
- People attributes including demographics, compensation, and performance data
- Productivity variables including staffing ratios, capacity percentage, skill mix, and volumes
- Engagement survey data including both department-level results and manager-level results
- Clinical data when available, such as number of patient falls or CAUTIs per month at the unit level
- Additional variables such as whether or not an employee has enrolled in our 403b, medical plan, or dental plan; if they’ve participated in learning and development; if their manager has participated in learning and development; and their manager’s performance rating
Depending on the job function, there could be anywhere from 15 to 40 variables that feed in to the algorithm. For example, for nursing we have a lot of data, so a larger number of variables get pulled in. And those variables may be different than other job functions (e.g., security officers).
AB: How do you communicate flight risk so HR business partners and leaders who aren’t on the analytics team can easily understand the data?
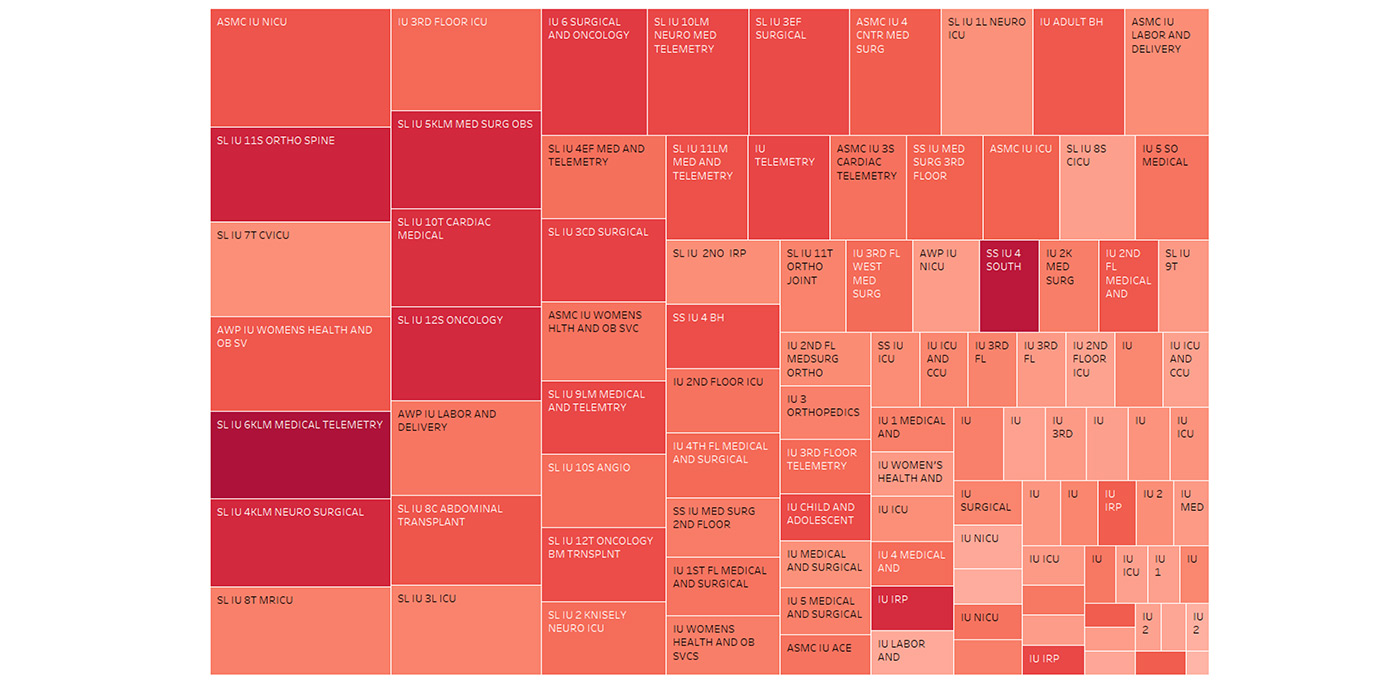
Chirag: That’s the most important part: making the output of the algorithm actionable. To do this, we feed the output into a heat map (using the data visualization tool Tableau) that gets updated monthly. This heat map helps HR business partners and leaders easily identify where the hot spots of retention risk are in the organization. It’s made up of boxes that vary by size and shade of red, representing the different areas within a location. The larger the box, the higher the number of employees in that area. The darker the shade of red, the higher the percentage of employees who are flagged as high risk.
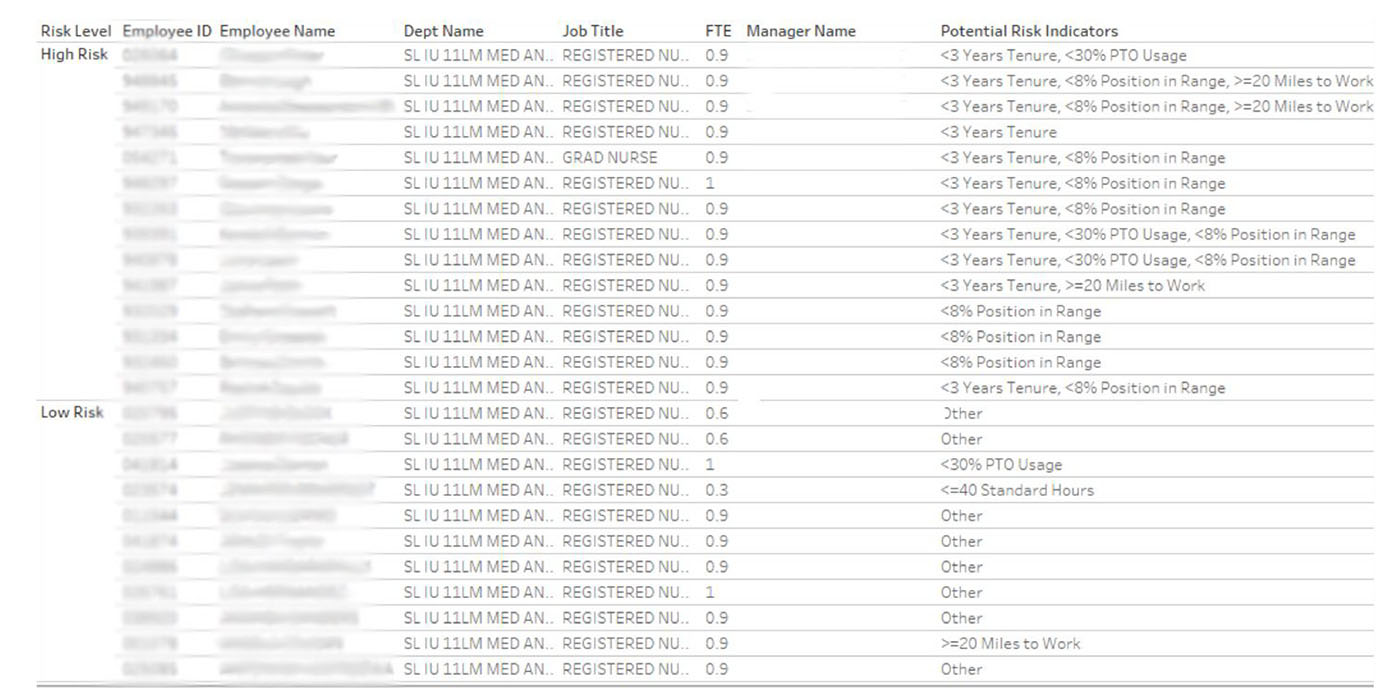
Within each box on the heat map is more granular data. You can click on a box and see the full list of individuals in that area, what their risk level is, and why they are a certain risk (i.e., the potential risk indicators associated with that individual).
AB: How do you and the HR team use the data?
Troy: The data is used at the system level and the individual level. At the system level, for example, the data showed us that being enrolled in our 403b correlated with being more likely to stay at the organization. Due to that data, we’ve budgeted for auto-enrollment.
HR business partners use the flight risk model in conjunction with operational leaders to prioritize and inform retention efforts at the individual level. For example, if there are 30 caregivers on a high-risk list in a given area, the HR business partner will work with that leader to identify who the high-performing staff are to prioritize first. From there, they can use the associated risk factors for a given individual to help inform how to approach a retention strategy, such as what to bring up or ask about in a stay interview.
We had one occasion where we learned one of our nurses was traveling to work at a location that was significantly farther from her home than one of our other hospitals. We were able address that with her, move her to the closer hospital, and keep retain her within the system (we don’t count internal transfers as turnover).
There’s incentive for both our HR business partners and leaders to use the tool. For HR business partners, using the tool is a line item included in their performance evaluations. Additionally, managers all have turnover goals in their performance evaluations. The fact that the heat map spotlights problem areas holds our managers accountable.
AB: As a large system spanning an entire state, how much do you customize the flight risk model based on where an employee works?
Chirag: The model has the ability to slice and dice different data cuts, whether that’s by job function or geography. You could say, “I want the output to look at nurses in Green Bay,” or “EVS in Greater Milwaukee South.” The input will be specific to that geography or job type.
The model is self-learning in terms of which drivers contribute to turnover on a statistical basis. And those drivers may vary based on the job function or the geography.
AB: What results have you seen so far with respect to turnover?
Chirag: Of all the turnover that happened last year, more than 70% was classified as high risk by the model. Since the beginning of 2016, we’ve had a 26% improvement in first-year turnover, 18% improvement in RN voluntary turnover, and 12% improvement in voluntary turnover overall.
Troy: And we know that turnover is directly correlated to engagement, clinical outcomes, and agency spending—so we are moving the dial there as well.
Overcoming barriers for shifting to predictive analytics
AB: Many organizations are intrigued by the potential power of predictive analytics, but face real barriers to using analytics to predict turnover—including poor data quality. How do you get the data you need and ensure it’s accurate before entering into the tool?
Chirag: That’s the biggest piece, right? Garbage in, garbage out. When first piloting the flight risk model, we dedicated a full FTE to it and spent approximately 70% of the time gathering, manipulating, and ensuring accuracy of the data. We did several validation workshops which took approximately six months.
To get started I had to fundamentally understand: What data do we have? Where does it reside? How can we get our hands on it? I hired an analyst with an IT background and we started by creating a data mart. IT was kind enough to carve out some space in their overall data warehouse for us to do so.
We pulled data from multiple sources into the data mart (e.g., PeopleSoft, Payroll, Epic, Learning Management, Benefits, etc.). And then took the following steps to incorporate all the data we need:
- We extracted all of the data from PeopleSoft (which housed all of the people data and variables I mentioned previously such as: date of hire, address, performance scores, etc.).
- We included all of the productivity data (e.g., payroll data, hours worked, hours spent on department orientation, patient volumes).
- Then we pulled in all of the ancillary data (e.g., HCAPHS data, safety data, workers compensation, incident claims file, engagement survey data, clinical data like patient falls and incidents of CAUTI).
- Once all of the data was in the data mart, we turned to matching the data down to the unit level.
We’ve now automated the ETL (extraction, transformation, loading) data process, meaning it’s an automated process to extract data from the different sources and load it in to the data mart. We still have about 0.5 of an FTE dedicated to making sure we have the quality data that can feed into the model and dashboards.
AB: Another barrier to moving to predictive analytics is having a team with the right skillset. For organizations interested in hiring their own data analytics team, what are the skills you recommend looking for?
Chirag: I primarily look for four different skillsets. The first: business intelligence (including back-end data mart/data warehouse administration skills, as well as front-end IT and data visualization skills). Second: analytical skills. Third: statistical skills. Lastly (and equally important): consulting skills. The consulting skill set is key to ensuring what you create is actionable by spending time internally consulting with HR business partners and leaders to help them understand and use the tool. I haven’t found one individual with all four of these skillsets perfected—but you want to make sure the sum of your team embodies these skills.
Troy: I would echo the importance of the last skill Chirag mentioned: consulting and relationship-building. That has been the difference for us. Chirag’s data analytics team spends a lot of time with my HR business partner team. It’s a real partnership.
What's next for Aurora's workforce analytics team
AB: As you continue to build out your workforce analytics capabilities, where will you focus your efforts next?
Troy: We are looking at patient experience and clinical outcomes and tying it to the variables we have in the data mart, such as people variables and productivity variables. The goal is to see what will get the biggest bang for the buck in terms of patient experience and clinical outcomes.
Chirag: We’ll also eventually explore creating a model to predict the quality of new hires.
Don't miss out on the latest Advisory Board insights
Create your free account to access 1 resource, including the latest research and webinars.
Want access without creating an account?
You have 1 free members-only resource remaining this month.
1 free members-only resources remaining
1 free members-only resources remaining
You've reached your limit of free insights
Become a member to access all of Advisory Board's resources, events, and experts
Never miss out on the latest innovative health care content tailored to you.
Benefits include:
Unlimited access to research and resources
Member-only access to events and trainings
Expert-led consultation and facilitation
The latest content delivered to your inbox
This content is available through your Curated Research partnership with Advisory Board. Click on ‘view this resource’ to read the full piece
Email ask@advisory.com to learn more
Click on ‘Become a Member’ to learn about the benefits of a Full-Access partnership with Advisory Board
Never miss out on the latest innovative health care content tailored to you.
Benefits Include:
Unlimited access to research and resources
Member-only access to events and trainings
Expert-led consultation and facilitation
The latest content delivered to your inbox
This is for members only. Learn more.
Click on ‘Become a Member’ to learn about the benefits of a Full-Access partnership with Advisory Board
Never miss out on the latest innovative health care content tailored to you.
Benefits Include:
Unlimited access to research and resources
Member-only access to events and trainings
Expert-led consultation and facilitation
The latest content delivered to your inbox