Auto logout in seconds.
Continue LogoutOverview
Leaders across the health care industry increasingly recognize the need to reduce disparities in care access, cost, and quality. To reduce these disparities, organizations must fully leverage their patient and community data to:
- Identify top opportunities for reducing disparities and inform initiatives to address them
- Monitor efforts and evaluate the success of their initiatives in reducing disparities in the short and long term
- Make the case for prioritizing health equity with dedicated investment
Leaders across the health care industry increasingly recognize the need to reduce disparities in care access, cost, and quality that impact patients based on their race, ethnicity, age, gender identity, sexual orientation, language, and other demographic and socioeconomic factors. Data is the backbone of any equity strategy, however most organizations have yet to fully leverage their internal data—from both quantitative and qualitative sources—in their approach to reducing disparities.
Traditionally, hospitals and health systems rely on their Community Health Needs Assessment (CHNA) and patient experience scores to identify inequitable care delivery and outcomes within their patient populations. However, most organizations that have this data fail to fully leverage it. As a result, many provider institutions struggle to identify which disparities their patients and community members are experiencing.

Piecemeal collection of data is just one part of a larger, long-standing lack of contextual data that we need to target resources.- Marcella Nunez-Smith, M.D., M.H.S.Co-chair, White House Covid-19 Health Equity Task Force
Insufficient data collection and analysis prevent provider organizations from having a holistic view of their patient population, which makes it hard to identify and eliminate the disparities they face. Without a robust data-driven approach, it is difficult—if not impossible—to set clear, measurable goals for reducing disparities and sustain long-term progress.
Health equity interventions that are not targeted to a specific patient population or identified need are unlikely to yield a real impact on outcomes. This can not only harm trust with patients or the community but also impact the viability of the entire organizational investment in health equity. To make a real impact, organizations must demonstrate they value health equity by bringing the same strategic rigor to these investments as they do with any other investment.
Organizations that have a true interest in improving health equity must take a data-driven approach to reducing disparities. Just as with any strategic priority, organizations should start by leveraging data to identify the scope of disparities their patients and community face. This data is key to informing an organization’s investment in initiatives to address disparities. Taking a data-driven approach allows organizations to:
- Identify top opportunities for reducing disparities and inform initiatives to address them
- Monitor efforts and evaluate the success of their initiatives in reducing disparities in the short and long term
- Make the case for prioritizing health equity with dedicated investment
One outcome of collecting robust data is that it helps combat the dual problems of denial and inaction. Many stakeholders struggle to accept that structural and provider bias are not only present but detrimental at their own organizations. Organization- and community-specific data collection provides incontrovertible, measurable proof of disparities in care delivery and within the community. This data helps reveal to staff and leaders that bias in all its forms has consequences not just in the communities that health care organizations serve, but also within the walls of the organization itself.
Collecting accurate patient demographic information is the foundation of a data-driven approach because it develops a clearer picture of a given patient population’s health status. Organizations need accurate demographic data to identify patient populations facing disparities at the point of care and in the broader community. Importantly, this data powerfully reinforces the case for addressing disparities.
To better understand their patient population, organizations should collect, at a minimum, both REGAL (Race, Ethnicity, Gender identity & sexual orientation, Age, and Language) data and data on the social determinants of health (SDOH) impacting people’s health status in their community. All organizations who are serious about their efforts to advance health equity need to make plans for broadening their demographic data collection if they are not yet at this point. While these data are a good starting point, over time aim to expand data collection to include additional sociodemographic domains, such as:
- Disability status
- Geography (i.e., urban, suburban, rural)
- Highest level of educational attainment
- Insurance status
- Religion
- Socioeconomic status (using payer as a proxy or percentage of federal poverty level)
- Veteran status
- ZIP code
Start with REGAL data to capture the intersections of identity
REGAL demographics have emerged as an industry standard because this data provides both a comprehensive and streamlined overview of a patient’s identity. When organizations fail to collect REGAL, they fail to capture key aspects of their patients’ identities. Collecting REGAL data provides insight into patient identity, which allows organizations to provide culturally sensitive and patient-centered care, better understand the needs of their patient population, and identify disparities.
While many organizations already collect basic demographic data on patients, there are often gaps in what data is collected and discrepancies in the data collection process. It's vital to break down REGAL data to identify intersections— capturing a full picture of each patient's identity. For example, it's not enough to look at patients by race. The experience of being a Black transgender woman is different than the experience of a Black man—and REGAL data aims to capture both.
There are two common pitfalls that organizations fall into when it comes to REGAL data collection:
- Organizations collect limited data on race and ethnicity. For example, when collecting patient demographic information, race and ethnicity are often grouped together. It’s important to distinguish between race and ethnicity: race refers to an individual’s physical traits, while ethnicity refers to an individual’s cultural identity or place of origin. While national standards include only two ethnicity categories, Hispanic and not Hispanic, many other ethnicities exist. For example, consider expanding data collection from the broader category of Asian to include more specific subsets like Chinese, Indian, Vietnamese, etc. Collecting data on ethnicity categories relevant to their local community better positions provider institutions to identify which groups are most at risk for experiencing a disparity and then better target interventions specific to those patient populations.
- Organizations collect gender identity data within the male-female binary. Traditionally, organizations have not included options for patients to share their sexual orientation or have had options for gender identity tha include only the male-female binary. By expanding options to include patients’ sexual orientation and gender identity, also commonly abbreviated to SOGI, organizations create a more inclusive environment, get a more accurate picture of care needs, and can better understand the experiences of their LGBTQ+ patients. Collecting SOGI demographics is one important step in a larger journey that health care organizations need to embark on to be more inclusive of their LGBTQ+ patients.
Layer on social needs data that has the biggest impact on health
According to the World Health Organization, SDOH are “the conditions in which people are born, grow, live, work and age.” These social factors have a profound impact on patients’ health status, and estimates show they can account for up to 60% of an individual’s health outcomes. However, health systems frequently do not account for patients’ social needs that may drive differences in care experiences and health outcomes. Collecting SDOH data gives health care providers a more comprehensive understanding of barriers to care. When combined with traditional clinical data, SDOH data promotes more effective care planning and interventions for individual patients, as well as a more accurate population risk assessment. Although collecting SDOH data may require more time and/or resources, it should ultimately save costs and effort because the patient’s care plan is aligned with their needs from the start.
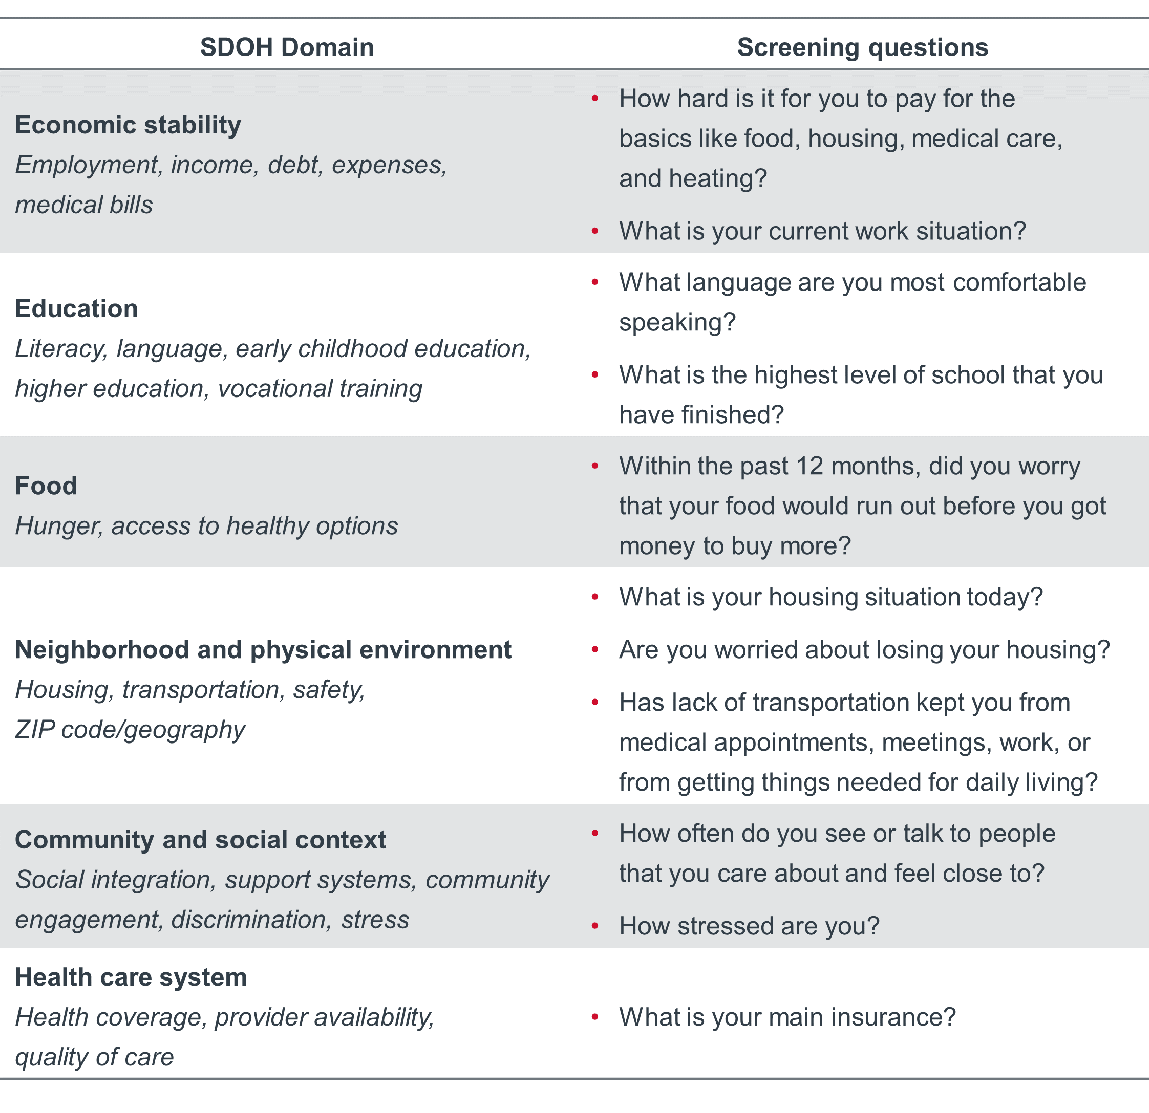
Organizations should prioritize SDOH data collection for social factors that have an outsized impact on a patient’s health status (e.g., housing, food security) and/or are already known to be present in the community and contributing to patients' health status.
Sample SDOH screening questions
Collecting SDOH and REGAL data
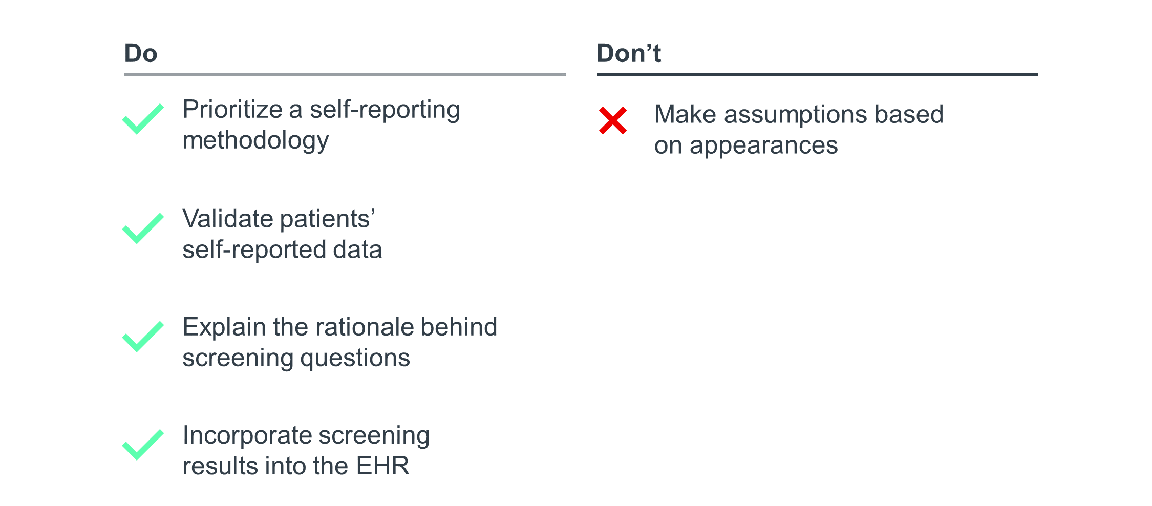
Identifying disparities in any given patient population begins with effective screening. When collecting patient demographic data, don’t make assumptions based on appearances, as these assumptions may not align with how the patient identifies. For example, while the majority of patients may identify within the gender binary (either as a man or woman), many patients will identify on a gender spectrum (transgender, nonbinary, genderfluid, etc.) and might not use traditional masculine (he/him/his) or feminine (she/her/hers) pronouns. A clinician can’t accurately determine the complex nuances of gender identity based on a patient’s physical appearance. Instead, it’s better to ask patients their gender identity and preferred pronouns, rather than guessing incorrectly.
A self-reporting methodology offers an effective alternative that reduces the administrative burden on staff, but also ensures more accurate data collection. Leverage the online patient portal to allow patients the chance to self-report their demographic data either ahead of planned care or at the beginning of their interaction with the system. Giving patients the chance to self-report their demographic data removes any guesswork by staff. It also helps patients feel more comfortable and honest about potentially sensitive information, ensuring reported data is as accurate a reflection of their identity and social needs as possible.
However, when self-reporting demographic data, some patients may fear that their personal information will be used to discriminate against them, causing them to leave questions or sections of the questionnaire blank. To overcome this, organizations should supplement self-reporting with at least one validation touchpoint between a staff member and the patient to fill any gaps in the patient’s self-reporting. During this touchpoint, a staff member should run through a few questions so the patient can quickly validate their responses and give them another opportunity to answer any blank questions. Staff should share that they ask all patients these questions, explain the rationale behind the questions, and clarify how the information is used. Equip staff with a standardized script to help ease any patient hesitancy.
Finally, incorporate screening results into the EHR to ensure visibility to all staff members coming into contact with the patient and to facilitate data analysis at the population level.
Checklist for collecting SDOH and REGAL data
To strengthen data collection efforts, supplement quantitative data with qualitative insight. Qualitative data adds context to trends in all aspects of patient care that might not be apparent in quantitative data alone.
Provider organizations can gather qualitative data through feedback channels to assess disparate outcomes across their patient populations and by surveying their communities to understand how inequitable community conditions impact health outcomes. Progressive organizations combine qualitative data from both internal and external sources to understand the full scope of health inequity.
Examples of internal qualitative data sources
- Patient experience scores: When collecting patient experience data, have patients identify their REGAL demographic data. Collecting data this way will allow insight into disparities in patient experience. However, due to significant disparities in response rates across patient demographics, experience data may not offer a complete picture. Do not use such data as evidence of the absence of a problem, especially with disparities in response rates. Supplement experience data with other sources of valuable qualitative feedback from listening channels for patients and the community.
- Patient and family advisory councils: The time-tested patient and family advisory council is an effective way to solicit the qualitative input needed to identify and design effective interventions to reduce disparities.
- Employee resource group (ERG): ERGs are voluntary groups that convene employees with a shared identity, interest, or goal. While these groups can help build engagement and inclusion, organizations should also leverage them as valuable sources of feedback to reduce disparities. Given their participants’ knowledge and lived experience, ERGs are uniquely positioned to provide actionable insight into the disparities staff members witness in care delivery.
Read now: How Employee Resource Groups Drive Diversity, Inclusion, and Business Outcomes
Read now: The CHRO�s Guide to Employee Resource Groups
Examples of community qualitative data sources
- Community health needs assessment (CHNA): A CHNA, done in partnership with local municipalities and other community health care providers, is a common starting point for organizations to identify both nonclinical and clinical care gaps in their market. This type of periodic needs assessment can help organizations understand both the social determinants that impact their current patients, as well as the needs of people who are not currently connected to the health care system.
Read now: 3 Imperatives for Investing in Successful Community Partnerships
- Community advisory boards (CABs): CABs are made up of community members who advise health systems on the needs of the local population and partner with the organization to identify and address health disparities. Because health systems are typically not representative of the full community they serve, health leaders on their own often struggle to identify the underlying drivers of disparities. By listening to the needs and preferences of marginalized groups, health leaders can better serve patients by addressing the community’s true barriers to care, as opposed to those perceived by the health system.
Read now: Community Advisory Boards
- Community partnerships and organizations: CHNAs and CABs may not give providers all the information needed to identify community care gaps and disparities. The easiest way to round out qualitative data collection is through targeted information surveys, community forums, and/or interviews with stakeholders who have firsthand knowledge of the needs in their community. Prioritize outreach to community stakeholders most likely to have high-level perspectives of broad community needs. This targeted outreach helps organizations contextualize quantitative data by developing a deeper understanding of the historic and current root causes of community health outcomes.
Read now: 10 Tools for Prioritizing Community Health Interventions
Use the following framework as a guide for gathering qualitative input on the community’s top health priorities.
Four steps to gather qualitative data on community health priorities
1. Identify organizations and groups for outreach
- Categorize organizations
- Identify organizations with the biggest community reach
- Select multiple stakeholders per organization to ensure appropriate representation
2. Prioritize outreach to those with deep community knowledge
- Use existing relationships to increase the likelihood of participation
- Reach out to organization leaders with high-level perspectives
3. Gather and centralize contact information for easy access
- Assign responsibility of database management with main points of contact
- Tap into existing, knowledgeable staff (e.g., community resource specialists)
4. Develop and disseminate templated outreach materials
- Strategize outreach method based on preferred modes of communication by each community segment
- Set a clear time frame for data collection
Soliciting qualitative feedback is not a stepwise process, but rather a continuous one. Organizations should revisit their sources of qualitative data throughout the prioritization, intervention design, and assessment processes.
To get comprehensive feedback, organizations must strive to hear from underrepresented voices. Pinpoint the demographic groups, community leaders, and organizations that need to be part of the data collection process to create a representative sample of the community.
Think critically about meeting logistics:
- Compensation: Do you compensate advisors for their valuable time and input?
- Meeting time: Can someone who does not work a traditional 9-to-5 job attend?
- Digital inequity: Can someone without access to home internet easily communicate with organizers? Do you provide the necessary technology for virtual meetings (e.g., computer, Wi-Fi, webcam) for those who need it?
- Transportation: Is the meeting accessible for someone who does not own a car? Do you cover transportation expenses?
- Language: Do you make language services available for advisors with limited English proficiency (e.g., in-person interpretation)?
Once you’ve collected the data, the next step is to uncover disparities. Data stratification provides concrete evidence that disparities at the point of care and within the broader community exist.
To pinpoint disparities in their patient population, organizations should aspire to stratify all key performance indicators (KPIs) by REGAL and SDOH data at least twice a year across service lines to identify health disparities. Most organizations recognize the importance of stratifying outcomes but don’t know where to start. We offer guidance below on which metrics to stratify, but these examples are not exhaustive.
Types of data and sample metrics to stratify
- Quality performance indicators: LOS, readmissions, National Hospital Quality Measures
- Clinical outcomes: Top clinical morbidities, patient satisfaction data, patient-reported outcome measures
- Department and service-line specific indicators: Nursing-sensitive indicators, use of physical or chemical restraints, activation of security
- Delivery of preventive services: Annual physical, mammogram
- Operational or process of care metrics: Wait times, decision to admit
The metrics above are examples of institution-oriented metrics, which help assess disparate outcomes across patients and the organization. Disparities in such metrics are some of the clearest examples of disparities at the point of care. These indicators show that unwarranted care variation is occurring and resulting in inequitable patient outcomes, including safety and quality failures such as adverse events and hospital-acquired conditions.
However, best-in-class organizations will also use community-oriented metrics to understand the full scope of health inequity. Community-oriented metrics can help organizations understand how inequitable community conditions impact health outcomes. See our Health Disparity Metric Picklist for a set of community-oriented metrics to analyze.
In addition to stratifying all clinical, operational, and population health performance indicators by REGAL, all organizations should also stratify key workforce KPIs. Example workforce metrics to stratify include diverse representation at all levels of the organization structure including leadership, retention, engagement, and disciplinary action.
Analyze data with an intersectional lens to identify groups most at risk of experiencing inequities
Most organizations use one layer of demographic data or SDOH to stratify quality performance indicators, department-specific indicators, delivery of preventive services, and process-of-care metrics.
While this is a good first step, organizations should strive to stratify this data by layering multiple demographics simultaneously, also referred to as taking an intersectional approach. An article in Harvard Business Review defines intersectionality as “how multiple…identities within an individual overlap and interact to create greater oppression for some groups of people due to the combination of identities (e.g., being Black and a woman).” Taking an intersectional approach when analyzing for disparities is powerful yet underutilized and allows one to reveal disparities that otherwise remain hidden. Analyzing multiple identities at once (such as race and gender) reveals how different types of oppression and privilege interact to impact outcomes. An intersectional analysis allows organizations to identify groups most at risk of experiencing inequities and better design targeted interventions to address those inequities.
For example, an organization might stratify readmissions by ethnicity and reveal that Latino patients have disproportionately higher readmission rates. This population is still broad, so the organization overlays readmissions among Latinx patients with more categories, such as language, age, and gender. Because of this added layer, they discover that male Latino non-English-speaking patients experience higher rates compared to female Latina English-speaking patients. Without an intersectional approach, this disparity would have remained hidden, and the organization’s efforts would not have been as targeted, and thus, effective.
After thoroughly stratifying performance metrics by intersectional demographics, an organization will likely uncover an overwhelming list of disparities to address. These disparities are likely to span key workforce, clinical, operational, and population health performance indicators. However, prioritization is essential when it comes to making meaningful and sustainable progress at reducing disparities.
The idea of prioritizing some patient populations over others can be uncomfortable. But it’s important to remember that certain populations are disproportionately impacted by disparities, and as a result require a disproportionate investment to remedy those inequities.
Organizations must make strategic trade-offs when it comes to prioritizing disparities. Like with any trade-off, the decision-making process will come down to values. Currently, there is no one-size-fits-all, “best” approach to prioritizing disparities. Organizations have different values, goals, and strategies to shape their future commitments. They also have varying historical legacies with modern-day manifestations (racism, intergenerational poverty, medical abuse), that have shaped their present-day community needs. Given finite resources, these factors need to be weighed when deciding which disparities to address first.
Satisfy 4 out of 5 key factors for prioritization
Use the prioritization framework below as a guide when deciding which disparities to address first. We recommend satisfying, at a minimum, four of the five factors to ensure you are prioritizing disparities that are feasible to effectively and sustainably address but are also in line with what the community needs and wants.
1. Community need: Is this disparity a priority for my organization’s broader community, including both staff and patients?
2. Ease of implementation: Does my organization have the infrastructure and resources to address the disparity? Is my staff already on board with this initiative or similar initiatives that it would take to address this disparity?
3. Severity of disparity: Will I focus on addressing the most disparate outcomes that have the most significant impact on health status in the shortand long-term?
4. Size of impacted population: How many people will be impacted if I reduce this disparity?
5. Financial value: Will addressing this disparity drive financial value for my organization?
Once an organization prioritizes a list of disparities to address, it’s time to set rigorous, measurable goals both for the short and long term. Significantly reducing, or even eliminating, any given disparity can take years. So, it’s important to balance both short- and long-term goals—thinking in terms of lead and lag indicators, or process and outcome metrics—to make sustainable progress. Short-term goals should incorporate process metrics, while long-term goals should include outcomes metrics.
Engaging with the community should be a central part of the goal-setting strategy. Leverage listening channels such as employee resource groups, patient and family advisory councils, or community advisory boards to hardwire regular opportunities for feedback. This will not only (re)build trust with the community but will also help ensure the organization’s work is meaningful, effective, and sustainable for the community.
Set short-term, ‘quick win’ goals to build momentum
Whether an organization is just getting started or looking to get to the next level of maturity in their work reducing disparities, start by setting achievable, short-term goals. These goals should serve as steppingstones to help achieve long-term, more transformational goals. Keep in mind the power of starting with ‘quick win’ goals that can be achieved in the near term. Demonstrating progress early on builds a foundation of trust with the community that can lead to increased engagement and partnership between all stakeholders, internal and external. Internally, quick wins remind leaders and their teams of the importance of this work and that reducing and eliminating disparities is both necessary and achievable.
Aim for transformational change with long-term goals
Given that efforts to reduce disparities are measured in the long term, an organization should settle on a short list of strategic goals to reduce disparities that serve as the organization’s North Star. Settling on this prioritized list of disparities to focus on system-wide should not preclude local service line leaders from establishing additional, area-specific goals. In fact, executive leaders should hold each service line accountable for doing so. However, we urge all leaders to prioritize making meaningful progress on a discrete set of disparities rather than spreading their efforts thinly across so many disparities that little progress is made, let alone sustained over the long term.
Set sights on the transformational end of the spectrum when it comes to long-term goals. The aspiration should be to achieve long-term community transformation by addressing the root causes of disparities.
Data visualization should be a central component of any organization’s strategy for reducing health disparities. While many organizations may hesitate to openly share data that reveals disparities, those disparities will exist whether they are visible on a dashboard or not. Data transparency can help inspire action, engage staff, build trust with key stakeholders such as patients and the community, and ensure that progress is sustained over the long term.
Dashboards bring visibility to current performance against goals
Some organizations track key metrics related to health equity but don’t have an effective way to visualize their current performance or a standardized process to share it with internal and external stakeholders. Siloing performance data limits visibility and, consequently, the accountability that data transparency inevitably encourages. When used effectively, data visualization helps monitor progress in reducing disparities, holding an organization accountable for the short- and long-term goals they have set.
Presenting health equity data in a dashboard allows stakeholders to visualize progress at a glance and recalibrate goals to ensure continuous progress. Share dashboards with predictable regularity in any forum where:
- Leaders convene to discuss clinical quality and safety performance data and/or health equity more broadly
- Representatives from the organization meet with external partners in the community
- Leaders and/or staff meet as part of shared governance related to clinical quality, safety, and/or health equity
Effective organizations share their dashboard internally with leaders and frontline staff, as well as externally with community partners on a weekly to monthly basis. The goal is to maximize data transparency, build trust, and instill a widespread sense of accountability across the organization and community
Consider including the following components in a dashboard to increase its impact on reducing disparities:
- Integration with existing dashboards for safety, quality, and experience
- Stratification of key performance indicators by REGAL demographics and data on SDOH
- Current performance against rigorous goals at the institution- and service-line levels
- Color-coding for scannability
- Facility- and system-level performance data to allow for internal and external comparisons against local, state, and national benchmarks
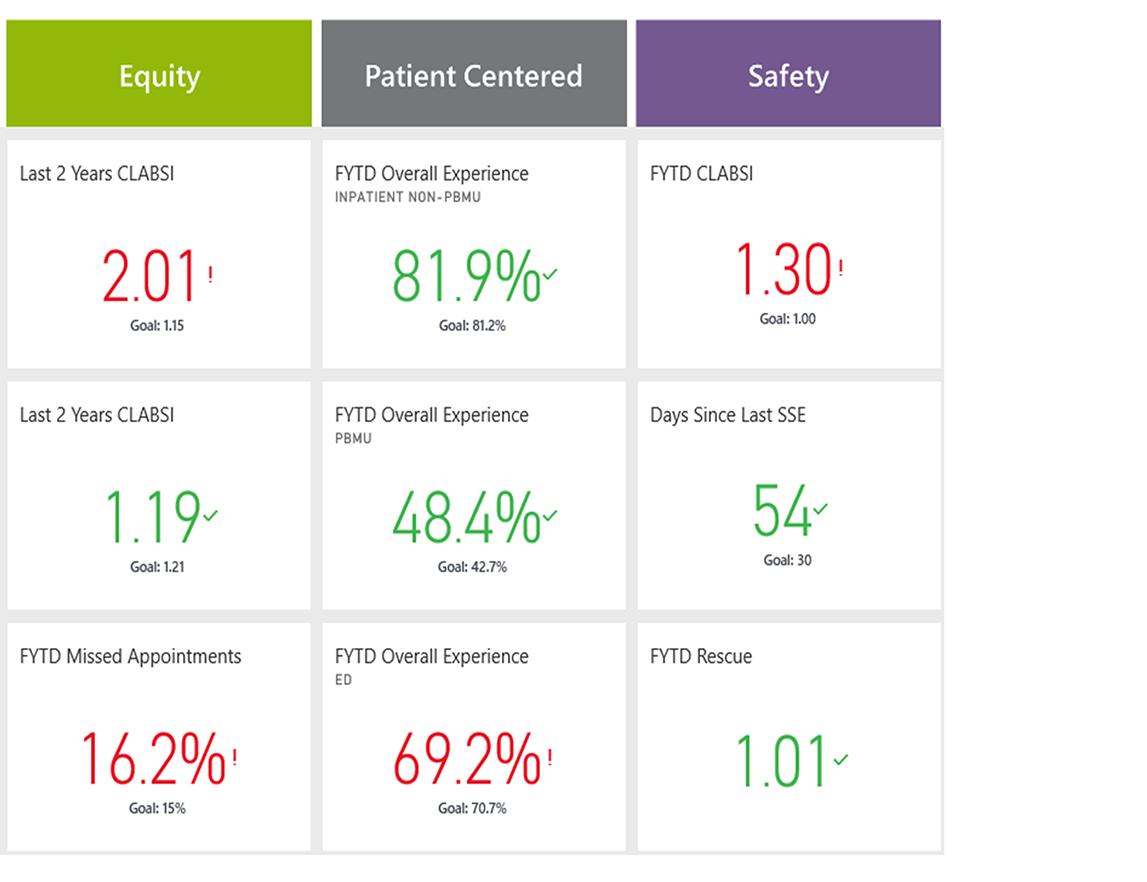
- Health equity scores
Clinical and health equity leaders at Seattle Children’s have developed a dashboard that features many of the components mentioned above.
If a dashboard isn’t feasible until the organization achieves greater maturity in its data infrastructure to reduce disparities, consider a lower-tech version. Simple scorecards incorporated in a PowerPoint slide that are regularly updated and circulated widely offer a workable alternative.
Provider organizations must address inequities among their patient population. But no matter how lofty an organizations’ health equity ambition, progress cannot be made without taking a data-driven approach. A truly data-driven approach requires the infrastructure to collect data and the technical resources to track and keep data transparent. It also requires leaders to be vulnerable and willing to own their gaps and shortcomings—internally and externally—and commit to short- and long-term goals to reduce them.
But simply identifying disparities and setting goals is not enough to create structural change. Leaders must address community-wide social needs and their root causes: intergenerational poverty and structural inequity. To advance health equity in the long term, leaders need to address these community-level factors that impact historically marginalized groups at disproportionate rates.
To start, leaders must understand the causes and effects of structural inequities and accept that players across the health care industry—from payers and health plans, to pharma, medical technology, and life sciences companies—all have a role to play. Then, leaders must tap into their data infrastructure to understand the full scope of the problem, strengthen partnerships with community and cross-industry health care leaders, and design transformational strategies for addressing structural inequities.
Ask our experts a question on any topic in health care by visiting our member portal.
Don't miss out on the latest Advisory Board insights
Create your free account to access 1 resource, including the latest research and webinars.
Want access without creating an account?
You have 1 free members-only resource remaining this month.
1 free members-only resources remaining
1 free members-only resources remaining
You've reached your limit of free insights
Become a member to access all of Advisory Board's resources, events, and experts
Never miss out on the latest innovative health care content tailored to you.
Benefits include:
Unlimited access to research and resources
Member-only access to events and trainings
Expert-led consultation and facilitation
The latest content delivered to your inbox
This content is available through your Curated Research partnership with Advisory Board. Click on ‘view this resource’ to read the full piece
Email ask@advisory.com to learn more
Click on ‘Become a Member’ to learn about the benefits of a Full-Access partnership with Advisory Board
Never miss out on the latest innovative health care content tailored to you.
Benefits Include:
Unlimited access to research and resources
Member-only access to events and trainings
Expert-led consultation and facilitation
The latest content delivered to your inbox
This is for members only. Learn more.
Click on ‘Become a Member’ to learn about the benefits of a Full-Access partnership with Advisory Board
Never miss out on the latest innovative health care content tailored to you.
Benefits Include:
Unlimited access to research and resources
Member-only access to events and trainings
Expert-led consultation and facilitation
The latest content delivered to your inbox